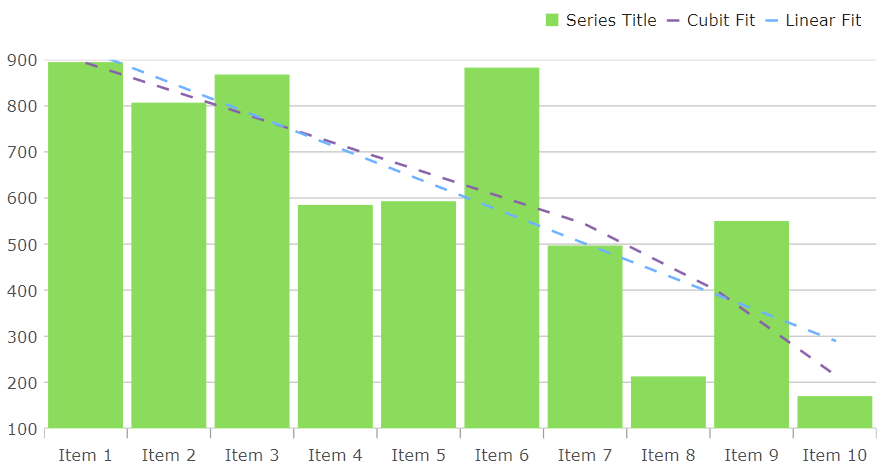

In Ultimate UI for WPF, the TrendLineLayer is a new series type that is designed to display a single trendline type for a target series. The difference between this and the existing trendline features on the existing series types is that since the TrendLineLayer is a series type, you can add more than one of them to the Series collection of the chart to have multiple trendlines attached to the same series. You can also have the trendline appear in the legend, which was not possible previously.
The following image depicts the usage of multiple TrendLineLayer elements targeting a single ColumnSeries:
The TrendLineLayer must be provided with a TargetSeries and a TrendLineType in order to work properly. The different trendline types that are available are the same as the trendlines that were available on the series, which are discussed in this topic.
If you would like to show the TrendLineLayer in the Legend, you can do so by setting its UseLegend property to true.
The following code snippet can be used to reproduce the same chart in the screenshot above:
In XAML
<Grid x:Name="layoutRoot">
    <ig:XamDataChart Legend="{Binding ElementName=legend}">
        <ig:XamDataChart.Axes>
            <ig:CategoryXAxis x:Name="xAxis" ItemsSource="{Binding Data}" Label="{}{Label}" />
            <ig:NumericYAxis x:Name="yAxis" MinimumValue="0" MaximumValue="1000"/>
        </ig:XamDataChart.Axes>
        <ig:XamDataChart.Series>
            <ig:ColumnSeries x:Name="series1" XAxis="{Binding ElementName=xAxis}"
                             YAxis="{Binding ElementName=yAxis}"
                             ItemsSource="{Binding Data}"
                             ValueMemberPath="Value" />
            <ig:TrendLineLayer TargetSeries="{Binding ElementName=series1}"
                   TrendLineType="CubicFit"
                   UseIndex="True"
                   UseLegend="True"
                   Title="Cubit Fit"/>
            <ig:TrendLineLayer TargetSeries="{Binding ElementName=series1}"
                   TrendLineType="LinearFit"
                   UseIndex="True"
                   UseLegend="True"
                   Title="Linear Fit" />
        </ig:XamDataChart.Series>
    </ig:XamDataChart>

    <ig:Legend x:Name="legend" Orientation="Horizontal" />
</Grid>
In C#
Legend legend = new Legend() { Orientation = Orientation.Horizontal };
XamDataChart chart = new XamDataChart() { Legend = legend };

CategoryXAxis xAxis = new CategoryXAxis()
{
    ItemsSource = data,
    Label = "{Label}"
};

NumericYAxis yAxis = new NumericYAxis()
{
    MinimumValue = 0,
    MaximumValue = 1000
};

ColumnSeries series1 = new ColumnSeries()
{
    XAxis = xAxis,
    YAxis = yAxis,
    ItemsSource = data,
    ValueMemberPath = "Value"
};

TrendLineLayer linearLayer = new TrendLineLayer()
{
    TargetSeries = series1,
    TrendLineType = TrendLineType.LinearFit,
    UseIndex = true,
    UseLegend = true,
    Title = "Linear Fit"
};

TrendLineLayer cubicLayer = new TrendLineLayer()
{
    TargetSeries = series1,
    TrendLineType = TrendLineType.CubicFit,
    UseIndex = true,
    UseLegend = true,
    Title = "Cubic Fit"
};

chart.Axes.Add(xAxis);
chart.Axes.Add(yAxis);

chart.Series.Add(series);
chart.Series.Add(linearLayer);
chart.Series.Add(cubicLayer);

layoutRoot.Children.Add(chart);
layoutRoot.Children.Add(legend);By default, the TrendLineLayer renders with the same color as its TargetSeries in a dashed line. This can be configured by using the various styling properties on the TrendLineLayer.
To change the color of the trendline that is drawn, you can set its Brush property. Alternatively, you can also set the UseIndex property to true, which will pull from the chart’s Brushes palette based on the index in which the TrendLineLayer is placed in the chart’s Series collection.
You can also modify the way that the TrendLineLayer appears by using its AppearanceMode and ShiftAmount properties. The ShiftAmount takes a double between -1.0 and 1.0 to determine how much of a "shift" to apply to the enumeration options that end in "Shift".
The following are the options for the AppearanceMode enumeration:
Auto: This will default to the DashPattern enumeration.
BrightnessShift: The trendline will take the TargetSeries brush and modify its brightness based on the provided ShiftAmount.
DashPattern: The trendline will appear as a dashed line. The frequency of the dashes can be modified by using the DashArray property on the TrendLineLayer.
OpacityShift: The trendline will take the TargetSeries brush and modify its opacity based on the provided ShiftAmount.
SaturationShift: The trendline will take the TargetSeries brush and modify its saturation based on the provided ShiftAmount.