
This topic demonstrates how to add a predefined shape to an Excel® Worksheet using the Infragistics Excel Engine.
This topic contains the following sections:
You need to first read the following topics:
With the Infragistics Excel Engine, you can manipulate a subset of predefined shapes in a Worksheet object.
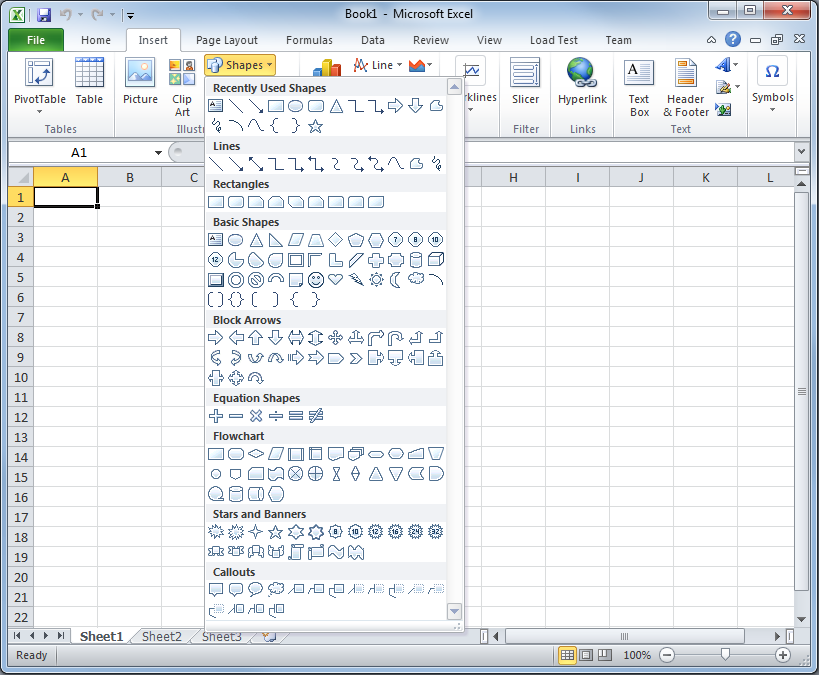
From a Excel’s user perspective, shapes are accessible from the Insert -> Shapes drop-down menu.
Unfortunatelly not all of these shapes are available through the Infragistics Excel Engine API.
All predefined shapes that are supported have a corresponding class defined for them in the Infragistics.Documents.Excel.PredefinedShapes Namespace. Each class derives (not necessary directly) from WorksheetShape Class. Those that are not directly derived from WorksheetShape Class are derived from WorksheetShapeWithText Class and have the ability to store formatted text in them.
Following is a list of the supported predefined shapes and the classes through which they are implemented.
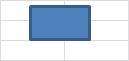
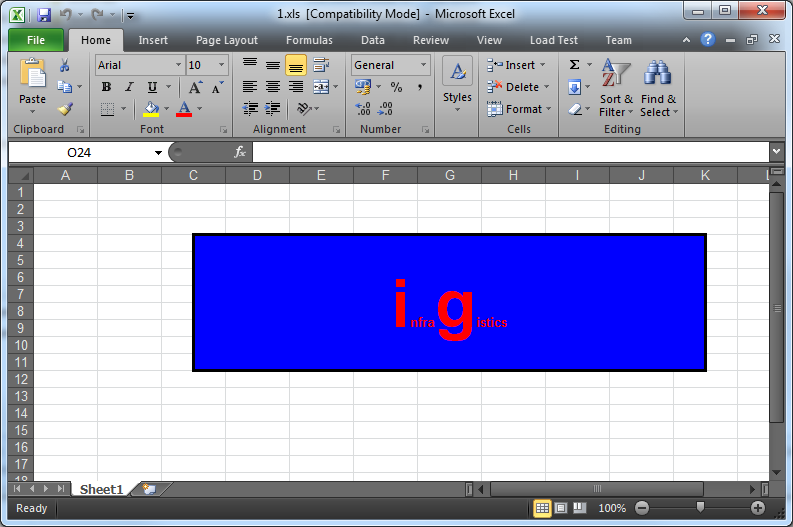
To add a shape to a worksheet initialize one of the predefined shapes, set its position, apply some customizations and add it to the worksheet. Detailed steps are provided below. In the procedure below, a blue-colored rectangle with a sample text in it is placed between C3 and K11 cells of an Excel grid. The rectangle’s side edges are positioned exactly on the middle of columns C and K, respectively.
Following is a preview of the final result displayed in Microsoft Excel 2010.
To complete the procedure, you need the following:
An initialized Excel workbook with access to one of its worksheet items.
Following is a conceptual overview of the process:
Creating a shape instance
Configuring the position and size
Customizing the shape
(Optional) Verifying the result
Create a shape instance. There are two ways to do this:
Using the shape’s constructor
Using the CreatePredefinedShape method
Each of them is demonstrated in the code below
Using the shape’s constructor.
In Visual Basic:
Dim shape As New RectangleShape()In C#:
RectangleShape shape = new RectangleShape();Using the CreatePredefinedShape method.
In Visual Basic:
Dim shape As RectangleShape =
    WorksheetShape.CreatePredefinedShape(PredefinedShapeType.Rectangle)
In C#:
RectangleShape shape =
    (RectangleShape)WorksheetShape.CreatePredefinedShape(PredefinedShapeType.Rectangle);
Configure the position and size. There are two positioning methods to do this.
Using cells (preffered)
Using twips
Using twips method is created to provide an easier way to specify shape’s coordinates. Both alignment methods end with the same result – aligning the shape using anchor cells (as “Using cells” works).
Each of them is demonstrated in code below. In both alignment methods you use the PositioningMode Property to specify the behavior of auto resizing the shape with the cells.
Using cells.
To position a shape in the Excel’s grid you need to specify top-left and bottom-right anchors (An anchor is a point, defined within a single cell. For example: The center of cell K9 or the top-right corner of the cell A0).
The TopLeftCornerCell and TopLeftCornerPosition properties define the top-left corner anchor and the BottomRightCornerCell and BottomRightCornerPosition properties define the bottom-right corner anchor.
The TopLeftCornerPosition property and BottomRightCornerPosition property contain a Point. The X and Y coordinates use relative (percentages) and not absolute values (pixels). For instance, Point(50,50) will place the control’s corner on the center of the selected cell. You should select an anchor cell by setting the TopLeftCornerCell and BottomRightCornerCell before setting the corresponding position.
In Visual Basic:
shape.TopLeftCornerCell = sheet.Rows(2).Cells(2)
shape.TopLeftCornerPosition = New System.Windows.Point(50, 100)
shape.BottomRightCornerCell = sheet.Rows(10).Cells(10)
shape.BottomRightCornerPosition = New System.Windows.Point(50, 100)
In C#:
shape.TopLeftCornerCell = sheet.Rows[2].Cells[2];
shape.TopLeftCornerPosition = new System.Windows.Point(50, 100);
shape.BottomRightCornerCell = sheet.Rows[10].Cells[10];
shape.BottomRightCornerPosition = new System.Windows.Point(50, 100);
Using twips
A twip is 1/20th of a point or 1/1440th of an inch. For example, in the 96 DPI resolution, one pixel has 15 twips in both width and height. Here, we use them to specify the top-left and right-bottom corner positions of the shape.
In this method the top-left corner and the size of the shape is set by the SetBoundsInTwips method which accepts a Worksheet object and a Rectangle object containing the coordinates of the shapes in twips.
The GetBoundsInTwips method can be used to retrieve the current position and size of a shape.
By using SetBoundsInTwips method you are setting the anchor cells based on the current configuration of the worksheet.
In Visual Basic:
shape.SetBoundsInTwips(sheet, New System.Windows.Rect(150, 150, 3000, 3000))In C#:
shape.SetBoundsInTwips(sheet, new System.Windows.Rect(150, 150, 3000, 3000));In this code above the shape is placed at 10, 10 at the top-left corner and 200, 200 at the bottom-right corner (in 96 DPI). This automatically sets the right cells and positions.
Customize the shape
Customize the shape as follows:
fill color - steel blue
outline color - royal blue
shape text - Infragistics.
In Visual Basic:
shape.Fill = ShapeFill.FromColor(System.Windows.Media.Colors.SteelBlue)
shape.Outline = ShapeOutline.FromColor(System.Windows.Media.Colors.RoyalBlue)
sheet.Shapes.Add(shape)
Dim ft As New Infragistics.Documents.Excel.FormattedText("infragistics")
shape.Text = ft
ft.GetFont(0, 12).Bold = ExcelDefaultableBoolean.[True]
ft.GetFont(0, 12).ColorInfo = New WorkbookColorInfo(Colors.Red)
ft.GetFont(0, 1).Height = 1000
ft.GetFont(5, 1).Height = 1000
In C#:
shape.Fill = ShapeFill.FromColor(System.Windows.Media.Colors.SteelBlue);
shape.Outline = ShapeOutline.FromColor(System.Windows.Media.Colors.RoyalBlue);
sheet.Shapes.Add(shape);
Infragistics.Documents.Excel.FormattedText ft =
    new Infragistics.Documents.Excel.FormattedText("infragistics");
shape.Text = ft;
ft.GetFont(0, 12).Bold = ExcelDefaultableBoolean.True;
ft.GetFont(0, 12).ColorInfo = new WorkbookColorInfo(Colors.Red);
ft.GetFont(0, 1).Height = 1000;
ft.GetFont(5, 1).Height = 1000;
For details, refer to the Customizing Shapes (Infragistics Excel Engine) topic.
Note that the shape was added to the Worksheet before setting the Text property. You can apply formatted strings on a shape only if the shape is added to a worksheet.
(Optional) Verify the result.
To verify the result, compile and run your application and then export the output of the procedure to an Excel file (for preview in Excel).