
The XamFinancialChart control allows you to determine what data you would like to show for your underlying data source’s time intervals.
The XamFinancialChart allows you to exclude intervals of data on the X-Axis by placing TimeAxisBreaks in the chart’s XAxisBreaks collection.
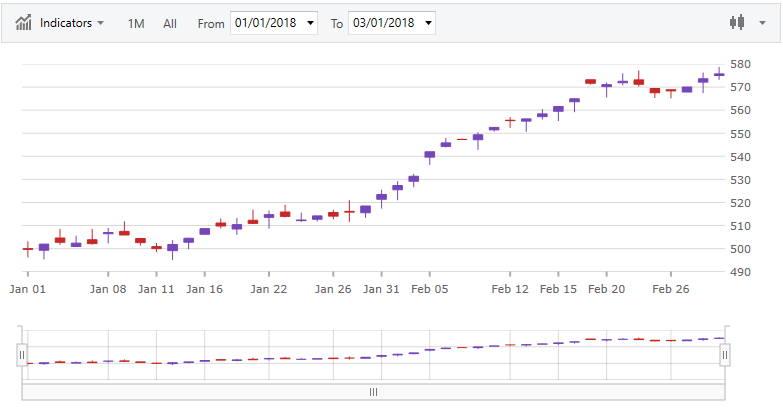
The following code example shows how to configure the XAxisBreaks collection to only show data not occurring on a weekend, resulting in a XamFinancialChart like the one shown below.
In XAML:
<ig:XamFinancialChart x:Name="chart" ItemsSource="{Binding}" XAxisMode="Time">
    <ig:XamFinancialChart.XAxisBreaks>
        <ig:TimeAxisBreak Start="2018-1-6T00:00:00" End="2018-1-7T23:59:59" Interval="7"/>
    </ig:XamFinancialChart.XAxisBreaks>
</ig:XamFinancialChart>
In C#:
var axisBreak = new TimeAxisBreak();
axisBreak.Start = new DateTime(2018, 1, 6, 0, 0, 0);
axisBreak.End = new DateTime(2018, 1, 7, 23, 59, 59);
axisBreak.Interval = new TimeSpan(7, 0, 0, 0);
chart.XAxisBreaks.Add(axisBreak);
In Visual Basic:
Dim axisBreak As TimeAxisBreak = New TimeAxisBreak()
axisBreak.Start = New DateTime(2018, 1, 6, 0, 0, 0)
axisBreak.End = New DateTime(2018, 1, 7, 23, 59, 59)
axisBreak.Interval = New TimeSpan(7, 0, 0, 0)
chart.XAxisBreaks.Add(axisBreak)