
This topic explains how to display a chart in the Spreadsheet.
The following table lists the topics required as a prerequisite to understanding this topic.
This topic contains the following sections:
Using ChartAdapter you can display the charts in the spreadsheet.The spreadsheet chart adapters creates and initializes chart elements for the spreadsheet based on a Infragistics.Documents.Excel.WorksheetChart instance.
In order to add a WorksheetChart to a worksheet, you must use the AddChart method of the worksheet’s Shapes collection.You can find more detail of adding charts in Excel here
Here are the steps by step description :
Add the SpreadsheetChartAdapter assembly reference to your project
Create an instance of a SpreadsheetChartAdapter class
Assign the chart adapter instance created in step 2 to the Spreadsheet’s Chart Adapter property
Run your app and load a worksheet containing a chart
There are over 35 chart types supported by the Spreadsheet ChartAdapters including, Line, Area, Column, and Doughnut. See the full list here:
Column Charts
Clustered column
Stacked column
100% stacked column
Line Charts
Line
Line with Markers
Stacked line
Stacked line with markers
100% stacked line
100% stacked line with markers
Pie Charts
Doughnut Charts
Bar Charts
Clustered bar
Stacked bar
100% stacked bar
Area Charts
Area
Stacked area
100% stacked area
XY (Scatter) and Bubble Charts
Scatter (with Marker only)
Scatter with smooth lines
Scatter with smooth lines and markers
Scatter with straight lines
Scatter with straight lines and markers
Bubble (without effects)
Stock Charts
High-low-close
Open-high-low-close
Volume-high-low-close
Volume-open-high-low-close
Radar Charts
Radar without markers
Radar with markers
Filled Radar
Combo Charts
Column and line chart sharing xAxis
Column and line chart and 2nd xAxis
Staked Area and Column
Custom Combination
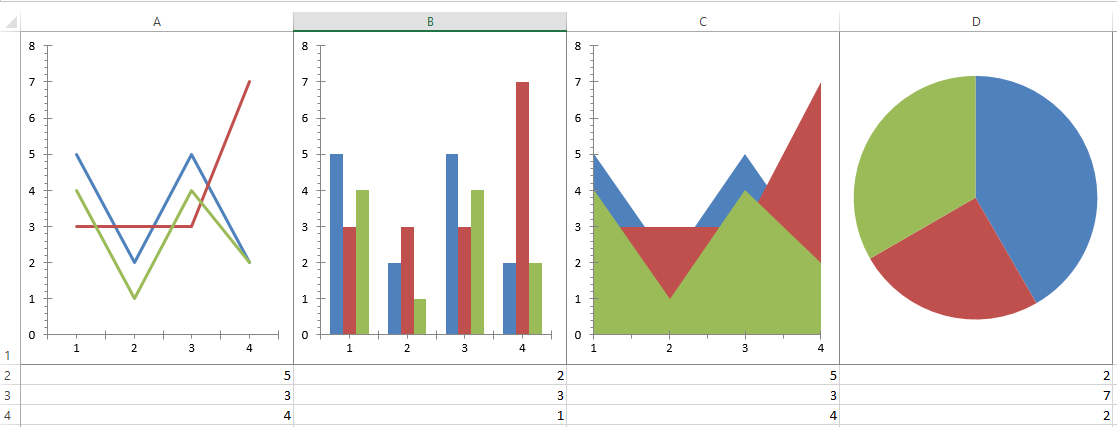
The following is a preview of the final result of a XamSpreadsheet with a Line, Column, Area and Pie chart displayed, along with the data used for each using the code snippets below:
Following is the code that implements this example.
In XAML:
<Page
  …
  xmlns:ig="http://schemas.infragistics.com/xaml"
   …>
    <ig:XamSpreadsheet x:Name="Spreadsheet1">
        <ig:XamSpreadsheet.ChartAdapter>
            <ig:SpreadsheetChartAdapter />
        </ig:XamSpreadsheet.ChartAdapter>
    </ig:XamSpreadsheet>
In C#:
Spreadsheet1 = new XamSpreadsheet();
Spreadsheet1.ChartAdapter = new SpreadsheetChartAdapter();

//Get the cells for the four charts that will placed in the Worksheet.
WorksheetCell cell1 = sheet.GetCell("A1");
WorksheetCell cell2 = sheet.GetCell("B1");
WorksheetCell cell3 = sheet.GetCell("C1");
WorksheetCell cell4 = sheet.GetCell("D1");

////Create Line chart.
WorksheetChart chart1 = sheet.Shapes.AddChart(Infragistics.Documents.Excel.Charts.ChartType.Line, cell1, new Point(0, 0), cell1, new Point(100, 100));
chart1.SetSourceData("A2:D4", true);

//Create Column chart.
WorksheetChart chart2 = sheet.Shapes.AddChart(Infragistics.Documents.Excel.Charts.ChartType.ColumnClustered, cell2, new Point(0, 0), cell2, new Point(100, 100));
chart2.SetSourceData("A2:D4", true);

//Create Area chart.
WorksheetChart chart3 = sheet.Shapes.AddChart(Infragistics.Documents.Excel.Charts.ChartType.Area, cell3, new Point(0, 0), cell3, new Point(100, 100));
chart3.SetSourceData("A2:D4", true);

//Create Pie chart.
WorksheetChart chart4 = sheet.Shapes.AddChart(Infragistics.Documents.Excel.Charts.ChartType.Pie, cell4, new Point(0, 0), cell4, new Point(100, 100));
chart4.SetSourceData("A2:D4", false);

this.Spreadsheet1.Workbook = workbook;
In Visual Basic:
Dim spreadsheet As XamSpreadsheet = New XamSpreadsheet()
spreadsheet1.ChartAdapter = New SpreadsheetChartAdapter()

' Get the cells for the four charts that will placed in the Worksheet.
Dim cell1 As WorksheetCell = sheet.GetCell("A1")
Dim cell2 As WorksheetCell = sheet.GetCell("B1")
Dim cell3 As WorksheetCell = sheet.GetCell("C1")
Dim cell4 As WorksheetCell = sheet.GetCell("D1")

' Create Line chart.
Dim chart1 As WorksheetChart = sheet.Shapes.AddChart(Infragistics.Documents.Excel.Charts.ChartType.Line, cell1, New Point(0, 0), cell1, New Point(100, 100))
chart1.SetSourceData("A2:D4", True)

' Create Column chart.
Dim chart2 As WorksheetChart = sheet.Shapes.AddChart(Infragistics.Documents.Excel.Charts.ChartType.ColumnClustered, cell2, New Point(0, 0), cell2, New Point(100, 100))
chart2.SetSourceData("A2:D4", True)

' Create Area chart.
Dim chart3 As WorksheetChart = sheet.Shapes.AddChart(Infragistics.Documents.Excel.Charts.ChartType.Area, cell3, New Point(0, 0), cell3, New Point(100, 100))
chart3.SetSourceData("A2:D4", True)

' Create Pie chart.
Dim chart4 As WorksheetChart = sheet.Shapes.AddChart(Infragistics.Documents.Excel.Charts.ChartType.Pie, cell4, New Point(0, 0), cell4, New Point(100, 100))
chart4.SetSourceData("A2:D4", False)

Me.Spreadsheet1.Workbook = workbookThe following topics provide additional information related to this topic.