
This topic provides detailed instructions to help you get up and running as soon as possible with the XamScatterSurface3D™ control.
The following topics are prerequisites to understanding this topic:
This topic contains the following sections:
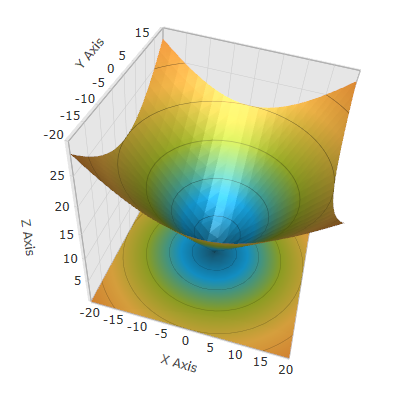
This example explains how to add a xamScatterSurface3D control to your page and bind it to a set of data points.
The following screenshot is a preview of the final result.
To complete the procedure, you need the following:
Create a WPF project and add the following NuGet package reference:
Infagistics.WPF.SurfaceChart3D
For more information on setting up the NuGet feed and adding NuGet packages, you can take a look at the following documentation: NuGet Feeds.
Add the following namespace declaration:
In XAML:
xmlns:ig="http://schemas.infragistics.com/xaml"In C#:
using Infragistics.Controls.Charts;In Visual Basic:
Imports Infragistics.Controls.ChartsAdd the xamSurfaceChart3D control to the page:
In XAML:
<ig:XamScatterSurface3D Name="SurfaceChart">
    <!-- ... -->
</ig:XamScatterSurface3D>
In C#:
var surfaceChart = new XamScatterSurface3D();In Visual Basic:
Dim surfaceChart = New XamScatterSurface3D()Following is a conceptual overview of the process:
The following steps demonstrate how to configure some basic options of the xamScatterSurface3D control and bind it to a set of data points.
Set the ItemsSource for the 3D Surface Chart:
In XAML:
<ig:XamScatterSurface3D Name="SurfaceChart"
    ItemsSource="{Binding Path=DataCollection}" …>
</ig:XamScatterSurface3D>In this particular code example, the data model has three properties – X, Y and Z that hold coordinate data that should be plotted. The XMemberPath, YMemberPath, and ZMemberPath properties create mappings between data model members and Axis coordinates.
In XAML:
<ig:XamScatterSurface3D Name="SurfaceChart"
    ItemsSource="{Binding Path=DataCollection}"
    XMemberPath="X" YMemberPath="Y" ZMemberPath="Z">
</ig:XamScatterSurface3D>Create 3 instances of LinearAxis objects and assign them to the XAxis, YAxis, and ZAxis properties of the Surface Chart:
In XAML:
<ig:XamScatterSurface3D Name="SurfaceChart"
    ItemsSource="{Binding Path=DataCollection}"
    XMemberPath="X" YMemberPath="Y" ZMemberPath="Z">
    <ig:XamScatterSurface3D.XAxis>
        <ig:LinearAxis Title="X Axis" />
    </ig:XamScatterSurface3D.XAxis>
    <ig:XamScatterSurface3D.YAxis>
        <ig:LinearAxis Title="Y Axis" />
    </ig:XamScatterSurface3D.YAxis>
    <ig:XamScatterSurface3D.ZAxis>
        <ig:LinearAxis Title="Z Axis" />
    </ig:XamScatterSurface3D.ZAxis>
</ig:XamScatterSurface3D>Following is the full code for this procedure.
In C#:
public class DataPoint
{
    public DataPoint() { }
    public DataPoint(double x, double y, double z)
    {
        this.X = x;
        this.Y = y;
        this.Z = z;
    }
    public double X { get; set; }
    public double Y { get; set; }
    public double Z { get; set; }
}
In Visual Basic:
public Class DataPoint
Public Sub New()
End Sub
Public Sub New(x As Double, y As Double, z As Double)
    Me.X = x
    Me.Y = y
    Me.Z = z
End Sub
Private m_X As Double
Private m_Y As Double
Private m_Z As Double
Public Property X() As Double
    Get
      Return m_X
    End Get
    Set
        m_X = Value
    End Set
End Property
Public Property Y() As Double
    Get
        Return m_Y
    End Get
    Set
        m_Y = Value
    End Set
End Property
Public Property Z() As Double
    Get
        Return m_Z
    End Get
    Set
        m_Z = Value
    End Set
End Property
End Class
In C#:
public class ViewModel
{
    public List<DataPoint> DataCollection { get; set; }
    public ViewModel()
    {
        DataCollection = GenerateFormulaData();
    }
    internal static List<DataPoint> GenerateFormulaData()
    {
        var data = new List<DataPoint>();
        for (int x = -20; x <= 20; x += 2)
        {
            for (int y = -20; y <= 20; y += 2)
            {
                double z = Math.Sqrt(Math.Pow(x, 2) + Math.Pow(y, 2));
                var point = new DataPoint(x, y, z);
                data.Add(point);
            }
        }
        return data;
    }
}
In Visual Basic:
Public Class ViewModel
    Public Property DataCollection() As List(Of DataPoint)
        Get
            Return m_DataCollection
        End Get
        Set
            m_DataCollection = Value
        End Set
    End Property
    Private m_DataCollection As List(Of DataPoint)
    Public Sub New()
        DataCollection = GenerateFormulaData()
    End Sub
    Friend Shared Function GenerateFormulaData() As List(Of DataPoint)
        Dim data = New List(Of DataPoint)()
        For x As Integer = -20 To 20 Step 2
            For y As Integer = -20 To 20 Step 2
                Dim z As Double = Math.Sqrt(Math.Pow(x, 2) + Math.Pow(y, 2))
                Dim point = New DataPoint(x, y, z)
                data.Add(point)
            Next
        Next
        Return data
    End Function
End Class
In XAML:
<Grid>
    <Grid.DataContext>
        <data:ViewModel />
    </Grid.DataContext>
    <ig:XamScatterSurface3D Name="SurfaceChart"
        ItemsSource="{Binding Path=DataCollection}"
        XMemberPath="X" YMemberPath="Y" ZMemberPath="Z">
        <ig:XamScatterSurface3D.XAxis>
            <ig:LinearAxis Title="X Axis" />
        </ig:XamScatterSurface3D.XAxis>
        <ig:XamScatterSurface3D.YAxis>
            <ig:LinearAxis Title="Y Axis" />
        </ig:XamScatterSurface3D.YAxis>
        <ig:XamScatterSurface3D.ZAxis>
            <ig:LinearAxis Title="Z Axis" />
        </ig:XamScatterSurface3D.ZAxis>
    </ig:XamScatterSurface3D>
</Grid>
In C#:
var surfaceChart = new XamScatterSurface3D();
surfaceChart.ItemsSource = new ViewModel().DataCollection;

surfaceChart.XMemberPath = "X";
surfaceChart.YMemberPath = "Y";
surfaceChart.ZMemberPath = "Z";

var xLinearAxis = new LinearAxis();
var yLinearAxis = new LinearAxis();
var zLinearAxis = new LinearAxis();

xLinearAxis.Title = "X Axis";
yLinearAxis.Title = "Y Axis";
zLinearAxis.Title = "Z Axis";

surfaceChart.XAxis = xLinearAxis;
surfaceChart.YAxis = yLinearAxis;
surfaceChart.ZAxis = zLinearAxis;
In Visual Basic:
Dim surfaceChart = New XamScatterSurface3D()
surfaceChart.ItemsSource = New ViewModel().DataCollection

surfaceChart.XMemberPath = "X"
surfaceChart.YMemberPath = "Y"
surfaceChart.ZMemberPath = "Z"

Dim xLinearAxis = New LinearAxis()
Dim yLinearAxis = New LinearAxis()
Dim zLinearAxis = New LinearAxis()

xLinearAxis.Title = "X Axis"
yLinearAxis.Title = "Y Axis"
zLinearAxis.Title = "Z Axis"

surfaceChart.XAxis = xLinearAxis
surfaceChart.YAxis = yLinearAxis
surfaceChart.ZAxis = zLinearAxisThe following topics provide additional information related to this topic.