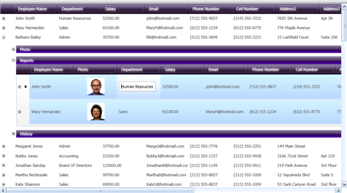

Grid View expresses your data in the form of a table, containing regular columns and rows. Tables help end users consume information when the number of columns ( Fields) is relatively small, compared to the number of rows ( Records), and the data is mostly homogeneous. Since most users are familiar with the table metaphor, you can take it far in expressing your data. Controls that offer a Grid View on data frequently support dynamic features such as:
The ability to rearrange the order of columns.
The ability to expand and collapse nested tables, and thereby show hierarchical (parent-child) relationships with data that may be more heterogeneous.
The ability to sort rows on multiple columns at one time.
The ability to group rows together, where values in certain columns match.
In the Ultimate UI for WPF product, the xamDataGrid™ and xamDataPresenter™ controls provide your users with the experience of a Grid View, with all of the above-mentioned features (and many more). The xamDataGrid control operates natively in Grid View (it knows no other paradigm for presenting information, and excels and what it does). The xamDataPresenter control has a pluggable view-based architecture, and can display in Grid View when you provide a GridView object to its View property. For a more detailed walkthrough, see Adding xamDataPresenter to Your Application.
The drawbacks of a Grid View are that it is easily over-used. Presenting too many rows at one time to users can overwhelm them. It doesn’t always handle large numbers of columns well because it forces users to scroll horizontally (see the Orientation property for a way to re-orient the grid horizontally).
Tables full of information can also be difficult to navigate. Often, the rectilinear regularity of a grid-like structure will help users find the information they are looking for. This is why many early cities developed downtown road systems based on grids; fewer people would get lost. This only works as long as the rows and columns provide cues that direct users to the information that is their goal.
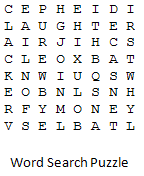
As the breadth and depth of data in a table increases, it becomes more like a word search puzzle. A word search puzzle hides words within piles of seemingly random letters. The idea behind a word search puzzle is that you want to find the real words in the jumble of letters. These words are like the information your users want from your application, but the jumble of letters are the unrelated data (it is "unrelated" at least, to what this specific user wants) that you may also be displaying. Like the Grid View, as if to make it easier for you, the creators of word search puzzles often arrange their letters into a grid.
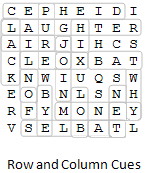
In any proper Grid View, there will be cues that you have placed to assist the user in finding the information they want. For example, you might associate Field Label on the columns, Record Headers on the rows, and you will arrange the data so that the greatest number of your users will have an easier time. In the word search puzzle, it will help you to find most of its real words if you scan each row and column, and circle every real word.
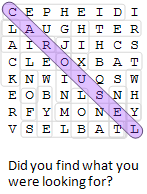
However, when your user is looking for a specific piece of information inside of your table, and that data has not been made immediately obvious from the cues of the rows and columns, then your table has become more like the word search puzzle. Ironically, it is the amount and arrangement of the data presented for some usage scenarios that will shift it from being information to being interference. Maybe if the data were presented to you along a diagonal, the sequence of letters in the word, "carousel", would have been easier to see.
Tables have a mundane quality to them. Many computer applications have adequately delivered their data by using a Grid View in the past. This was because of user-familiarity with the metaphor, but also because tables have enjoyed an economic advantage. When the computing power and graphics capabilities of desktop machines were more limited than it is today, the processing and video demands of laying out figures in a regular grid-like pattern were relatively inexpensive. However, advances in today’s computer technology have now raised user expectations, and have made possible what may have seemed like impossibly fantastic Views only a few years ago.
Consider how your users can get the most value from your data, and then select an appropriate View.