
This topic explains, with code examples, how to use Polar Spline Area Series in the XamDataChart™ control.
Polar Spline Area Series has a shape of a filled region enclosed by a collection of spline lines connecting data points which are located at the polar (angle/radius) coordinates. The PolarSplineAreaSeries uses the same concepts of data plotting as the ScatterSplineSeries but wraps data points around a circle rather than stretching them along a horizontal line. Like with other series types, multiple PolarAreaSeries can be plotted in the same data chart and they can be overlaid on each other to show the differences and similarities between data sets. For more information on this group of series, refer to the Radial Series topic.
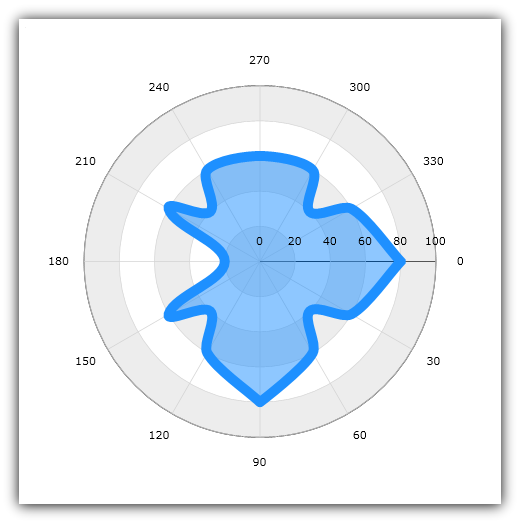
Figure 1 demonstrates what Polar Spline Area Series looks like when plotted in the XamDataChart control.
Figure 1: Sample implementation of a PolarSplineAreaSeries
The code snippet below shows how to bind sample polar data (which is available for download from the Sample Polar Data resource) to the PolarSplineAreaSeries. The example assumes that you have already configured your project for the XamDataChart control.
In XAML:
xmlns:local="clr-namespace:Infragistics.Models;assembly=YourAppName"
...
<ig:XamDataChart x:Name="DataChart" >
    <ig:XamDataChart.Resources>
		<ResourceDictionary>
			<local:PolarDataSource x:Key="data" />
		</ResourceDictionary>
    </ig:XamDataChart.Resources>
    <ig:XamDataChart.Axes>
        <ig:NumericAngleAxis  x:Name="AngleAxis"  MinimumValue="0" MaximumValue="360" Interval="30"/>
        <ig:NumericRadiusAxis x:Name="RadiusAxis" MinimumValue="0" MaximumValue="100" Interval="20"/>
    </ig:XamDataChart.Axes>
    <ig:XamDataChart.Series>
        <ig:PolarSplineAreaSeries AngleAxis="{x:Reference AngleAxis}"
                            RadiusAxis="{x:Reference RadiusAxis}"
                            AngleMemberPath="Angle"
                            RadiusMemberPath="Radius"
                            ItemsSource="{StaticResource data}"
                            Thickness="5"
                            MarkerType="None"
                            Brush="#7F58A6C7">
        </ig:PolarSplineAreaSeries>
    </ig:XamDataChart.Series>
</ig:XamDataChart>
In C#:
var data = new PolarDataSource();
var AngleAxis = new NumericYAxis();
var RadiusAxis = new CategoryXAxis();

var series = new PolarSplineAreaSeries();
series.ItemsSource = data;
series.AngleMemberPath = "Angle";
series.RadiusMemberPath = "Radius";
series.AngleAxis = AngleAxis;
series.RadiusAxis = RadiusAxis;

var chart = new XamDataChart();
chart.Axes.Add(AngleAxis);
chart.Axes.Add(RadiusAxis);
chart.Series.Add(series);