
This topic explains, with code examples, how to use Radial Area Series in the XamDataChart™ control.
Radial Area Series has a shape of a filled polygon that is bound by a collection of straight lines connecting data points. The RadialAreaSeries uses the same concepts of data plotting as the AreaSeries but wraps data points around a circle rather than stretching them along a horizontal line. For more information on this group of series, refer to the Radial Series topic.
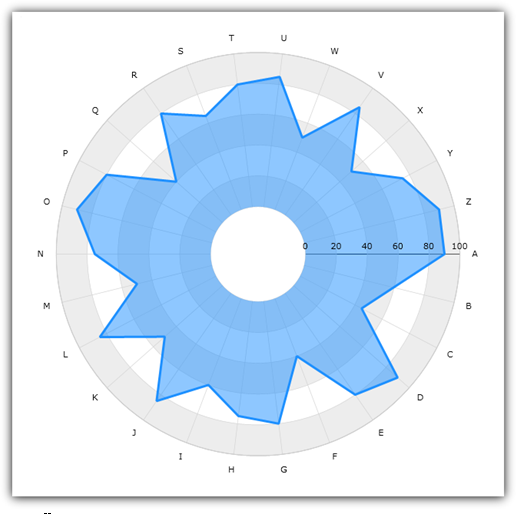
Figure 1 demonstrates what Radial Area Series looks like when plotted in the XamDataChart control.
Figure 1: Sample implementation of a RadialAreaSeries
The code snippet below shows how to bind sample radial data (which is available for download from the Sample Category Data resource) to the RadialAreaSeries. The example assumes that you have already configured your project for the XamDataChart control.
In XAML:
xmlns:local="clr-namespace:Infragistics.Models;assembly=YourAppName"
...
<ig:XamDataChart x:Name="DataChart">
    <ig:XamDataChart.Resources>
		<ResourceDictionary>
			<local:CategoryDataSource x:Name="data" />
		</ResourceDictionary>
    </ig:XamDataChart.Resources>
    <ig:XamDataChart.Axes>
        <ig:CategoryAngleAxis x:Name="angleAxis"
                              Interval="1"
                              Label="Category"
                              ItemsSource="{StaticResource data}">
        </ig:CategoryAngleAxis>
        <ig:NumericRadiusAxis x:Name="radiusAxis"
                              MinimumValue="0"
                              MaximumValue="150"
                              Interval="50"
                              RadiusExtentScale="0.8"
                              InnerRadiusExtentScale="0.2">
        </ig:NumericRadiusAxis>
    </ig:XamDataChart.Axes>
    <ig:XamDataChart.Series>
        <ig:RadialAreaSeries AngleAxis="{x:Reference angleAxis}"
                             ValueAxis="{x:Reference radiusAxis}"
                             ValueMemberPath="Value"
                             Brush="#7F58A6C7"
                             MarkerType="None"
                             Outline="#FF58A6C7"
                             Thickness="5"
                             ItemsSource="{StaticResource data}">
        </ig:RadialAreaSeries>
    </ig:XamDataChart.Series>
</ig:XamDataChart>
In C#:
var data = new CategoryDataSource();

var angleAxis = new CategoryAngleAxis();
angleAxis.ItemsSource = data;
angleAxis.Label = "{Category}";
angleAxis.Interval = 1;

var radiusAxis = new NumericRadiusAxis();
radiusAxis.MinimumValue = 0;
radiusAxis.MaximumValue = 150;
radiusAxis.Interval = 50;
radiusAxis.RadiusExtentScale = 0.8;
radiusAxis.InnerRadiusExtentScale = 0.2;

var series = new RadialAreaSeries();
series.ItemsSource = data;
series.ValueMemberPath = "Value";
series.AngleAxis = angleAxis;
series.ValueAxis = radiusAxis;
series.MarkerType = MarkerType.None;
series.Thickness = 5;

var chart = new XamDataChart();
chart.Axes.Add(angleAxis);
chart.Axes.Add(radiusAxis);
chart.Series.Add(series);