
This topic explains, with code examples, how to use Radial Pie Series in the XamDataChart™ control.
Radial Pie Series uses pie slices that extend from the center of chart towards locations of data points. The RadialPieSeries take concepts of categorizing multiple series of data points and wrapping them around on a circle rather than stretching data points along a horizontal line. For more information on this group of series, please refer to the Radial Series topic.
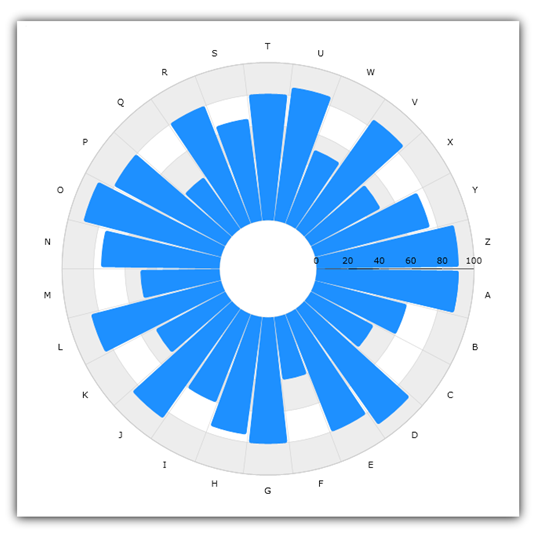
Figure 1 demonstrates what Radial Pie Series looks like when plotted in the XamDataChart control.
Figure 1: Sample implementation of a RadialPieSeries
The code snippet below shows how to bind sample radial data (which is available for download from the Sample Category Data resource) to the RadialPieSeries. The example assumes that you have already configured your project for the XamDataChart control.
In XAML:
xmlns:local="clr-namespace:Infragistics.Models;assembly=YourAppName"
...
<ig:XamDataChart x:Name="DataChart">
    <ig:XamDataChart.Resources>
		<ResourceDictionary>
			<local:CategoryDataSource x:Name="data" />
		</ResourceDictionary>
    </ig:XamDataChart.Resources>
    <ig:XamDataChart.Axes>
        <ig:CategoryAngleAxis x:Name="angleAxis"
                              Interval="1"
                              Label="Category"
                              ItemsSource="{StaticResource data}">
        </ig:CategoryAngleAxis>
        <ig:NumericRadiusAxis x:Name="radiusAxis"
                              MinimumValue="0"
                              MaximumValue="150"
                              Interval="50"
                              RadiusExtentScale="0.8"
                              InnerRadiusExtentScale="0.2">
        </ig:NumericRadiusAxis>
    </ig:XamDataChart.Axes>
    <ig:XamDataChart.Series>
        <ig:RadialPieSeries AngleAxis="{x:Reference angleAxis}"
                             ValueAxis="{x:Reference radiusAxis}"
                             ValueMemberPath="Value"
                             Brush="#7F58A6C7"
                             MarkerType="None"
                             Outline="#FF58A6C7"
                             Thickness="5"
                             ItemsSource="{StaticResource data}">
        </ig:RadialPieSeries>
    </ig:XamDataChart.Series>
</ig:XamDataChart>
In C#:
var data = new CategoryDataSource();

var angleAxis = new CategoryAngleAxis();
angleAxis.ItemsSource = data;
angleAxis.Label = "{Category}";
angleAxis.Interval = 1;

var radiusAxis = new NumericRadiusAxis();
radiusAxis.MinimumValue = 0;
radiusAxis.MaximumValue = 150;
radiusAxis.Interval = 50;
radiusAxis.RadiusExtentScale = 0.8;
radiusAxis.InnerRadiusExtentScale = 0.2;

var series = new RadialPieSeries();
series.ItemsSource = data;
series.ValueMemberPath = "Value";
series.AngleAxis = angleAxis;
series.ValueAxis = radiusAxis;
series.MarkerType = MarkerType.None;
series.Thickness = 5;

var chart = new XamDataChart();
chart.Axes.Add(angleAxis);
chart.Axes.Add(radiusAxis);
chart.Series.Add(series);