Ignite UI for Angular Changelog (Data Visualization)
All notable changes for each version of Ignite UI for Angular are documented on this page.
[!Note] For changes specific to Angular LOB components, please see Ignite UI Angular Changes
Angular 13.1.0 (November 2021)
Charts & Maps
This release introduces a few improvements and simplifications to visual design and configuration options for the geographic map and all chart components.
- Changed
yAxisLabelLocationproperty's type to YAxisLabelLocation from AxisLabelLocation inIgxFinancialChartComponentandIgxCategoryChartComponent - Changed
xAxisLabelLocationproperty's type to XAxisLabelLocation from AxisLabelLocation inIgxFinancialChartComponent - Added
xAxisLabelLocationproperty toIgxCategoryChartComponent - Added support for representing geographic series of
IgxGeographicMapComponentin a legend - Added crosshair lines by default in
IgxFinancialChartComponentandIgxCategoryChartComponent - Added crosshair annotations by default in
IgxFinancialChartComponentandIgxCategoryChartComponent - Added final value annotation by default in
IgxFinancialChartComponent - Added new properties in Category Chart and Financial Chart:
crosshairsLineThicknessand other properties for customizing crosshairs linescrosshairsAnnotationXAxisBackgroundand other properties for customizing crosshairs annotationsfinalValueAnnotationsBackgroundand other properties for customizing final value annotationsareaFillOpacitythat allow changing opacity of series fill (e.g. Area chart)markerThicknessthat allows changing thickness of markers
- Added new properties in Category Chart, Financial Chart, Data Chart, and Geographic Map:
markerAutomaticBehaviorthat allows which marker type is assigned to multiple series in the same chartlegendItemBadgeShapefor setting badge shape of all series represented in a legendlegendItemBadgeModefor setting badge complexity on all series in a legend
- Added new properties in Series in Data Chart and Geographic Map:
legendItemBadgeShapefor setting badge shape on specific series represented in a legendlegendItemBadgeModefor setting badge complexity on specific series in a legend
- Changed default vertical crosshair line stroke from #000000 to #BBBBBB in category chart and series
- Changed shape of markers to circle for all series plotted in the same chart. This can be reverted by setting chart's
markerAutomaticBehaviorproperty toSmartIndexedenum value - Simplified shapes of series in chart's legend to display only circle, line, or square. This can be reverted by setting chart's
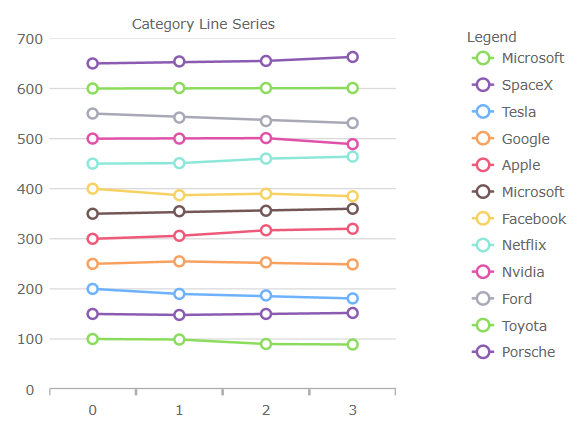
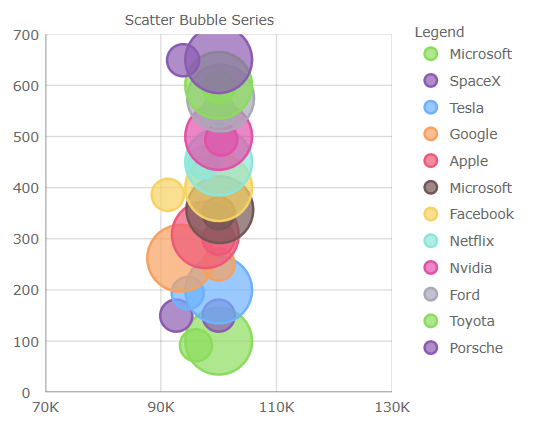
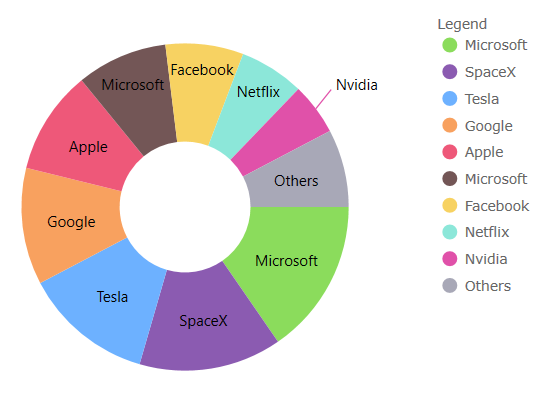
legendItemBadgeModeproperty toMatchSeriesenum value - Changed color palette of series and markers displayed in all charts to improve accessibility
| Old brushes/outlines | New outline/brushes |
|---|---|
| #8BDC5C #8B5BB1 #6DB1FF #F8A15F #EE5879 #735656 #F7D262 #8CE7D9 #E051A9 #A8A8B7 |
#8BDC5C #8961A9 #6DB1FF #82E9D9 #EA3C63 #735656 #F8CE4F #A8A8B7 #E051A9 #FF903B |
Angular 11.2.0 (April 2021)
Charts & Maps
This release introduces several new and improved visual design and configuration options for all of the chart components, e.g. IgxDataChartComponent, IgxCategoryChartComponent, and IgxFinancialChartComponent.
- Changed Bar/Column/Waterfall series to have square corners instead of rounded corners
- Changed Scatter High Density series’ colors for heat min property from #8a5bb1 to #000000
- Changed Scatter High Density series’ colors for heat max property from #ee5879 to #ee5879
- Changed Financial/Waterfall series’
NegativeBrushandNegativeOutlineproperties from #C62828 to #ee5879 - Changed marker's thickness to 2px from 1px
- Changed marker's fill to match the marker's outline for
IgxPointSeriesComponent,IgxBubbleSeriesComponent,IgxScatterSeriesComponent,IgxPolarScatterSeriesComponent. You can use setmarkerFillModeproperty to Normal to undo this change - Compressed labelling for the
IgxTimeXAxisComponentandIgxOrdinalTimeXAxisComponent - New Marker Properties:
- series.
markerFillMode- Can be set toMatchMarkerOutlineso the marker depends on the outline - series.
markerFillOpacity- Can be set to a value 0 to 1 - series.
markerOutlineMode- Can be set toMatchMarkerBrushso the marker's outline depends on the fill brush color
- series.
- New Series Property:
- series.
outlineMode- Can be set to toggle the series outline visibility. Note, for Data Chart, the property is on the series
- series.
- New chart properties that define bleed over area introduced into the viewport when the chart is at the default zoom level. A common use case is to provide space between the axes and first/last data points. Note, the
computedPlotAreaMarginMode, listed below, will automatically set the margin when markers are enabled. The others are designed to specify aDoubleto represent the thickness, where PlotAreaMarginLeft etc. adjusts the space to all four sides of the chart:- chart.
plotAreaMarginLeft - chart.
plotAreaMarginTop - chart.
plotAreaMarginRight - chart.
plotAreaMarginBottom - chart.
computedPlotAreaMarginMode
- chart.
- New Highlighting Properties
- chart.
highlightingMode- Sets whether hovered or non-hovered series to fade, brighten - chart.
highlightingBehavior- Sets whether the series highlights depending on mouse position e.g. directly over or nearest item - Note, in previous releases the highlighting was limited to fade on hover.
- chart.
- Added Highlighting Stacked, Scatter, Polar, Radial, and Shape series:
- Added Annotation layers to Stacked, Scatter, Polar, Radial, and Shape series:
- Added support for overriding the data source of individual stack fragments within a stacked series
- Added custom style events to Stacked, Scatter, Range, Polar, Radial, and Shape series
- Added support to automatically sync the vertical zoom to the series content
- Added support to automatically expanding the horizontal margins of the chart based on the initial labels displayed
- Redesigned color palette of series and markers:
| Old brushes/outlines | New outline/brushes |
|---|---|
| #7446B9 #9FB328 #F96232 #2E9CA6 #DC3F76 #FF9800 #3F51B5 #439C47 #795548 #9A9A9A |
#8bdc5c #8b5bb1 #6db1ff #f8a15f #ee5879 #735656 #f7d262 #8ce7d9 #e051a9 #a8a8b7 |
for example:
 |
 |
 |
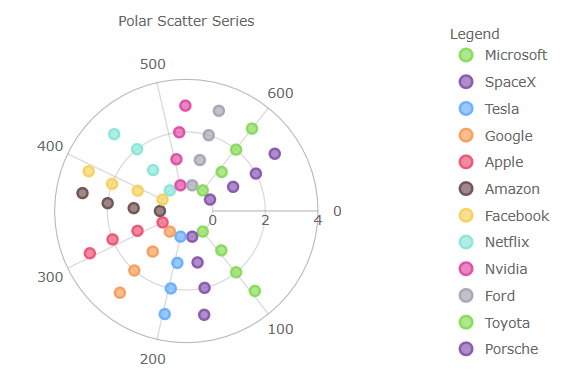 |
Chart Legend
- Added horizontal
Orientationproperty to ItemLegend that can be used with Bubble, Donut, and Pie Chart - Added
legendHighlightingModeproperty - Enables series highlighting when hovering over legend items
Geographic Map
[!Note] These features are CTP
- Added support for wrap around display of the map (scroll infinitely horizontally)
- Added support for shifting display of some map series while wrapping around the coordinate origin
- Added support for highlighting of the shape series
- Added support for some annotation layers for the shape series
Angular 8.2.12
- Changed Import Statements
Import statements have been simplified to use just package names instead of full paths to API classes and enums.
[!Note] These breaking changes were introduce in these packages and components only:
| Affected Packages | Affected Components |
|---|---|
| igniteui-angular-excel | Excel Library |
| igniteui-angular-spreadsheet | Spreadsheet |
| igniteui-angular-maps | Geo Map, Treemap |
| igniteui-angular-gauges | Bullet Graph, Linear Gauge, Radial Gauge |
| igniteui-angular-charts | Category Chart, Data Chart, Donut Chart, Financial Chart], Pie Chart, Zoom Slider |
| igniteui-angular-core | all classes and enums |
- Code After Changes
Now, you need to use just package names instead of full paths to API classes and enums.
Please also note that the name of the Data Grid component and its corresponding modules have also changed.
// gauges:
import { IgxLinearGauge } from "igniteui-angular-gauges";
import { IgxLinearGaugeModule } from "igniteui-angular-gauges";
import { IgxLinearGraphRange } from "igniteui-angular-gauges";
import { IgxRadialGauge } from 'igniteui-angular-gauges}';
import { IgxRadialGaugeModule } from 'igniteui-angular-gauges';
import { IgxRadialGaugeRange } from 'igniteui-angular-gauges';
import { SweepDirection } from 'igniteui-angular-core';
// charts:
import { IgxFinancialChartComponent } from "igniteui-angular-charts";
import { IgxFinancialChartModule } from "igniteui-angular-charts";
import { IgxDataChartComponent } from "igniteui-angular-charts";
import { IgxDataChartCoreModule } from "igniteui-angular-charts";
// maps:
import { IgxGeographicMapComponent } from "igniteui-angular-maps";
import { IgxGeographicMapModule } from "igniteui-angular-maps";
- Code Before Changes
Before, you had to import using full paths to API classes and enums:
// gauges:
import { IgxLinearGaugeComponent } from 'igniteui-webcomponents-gauges/ES5/igx-linear-gauge-component';
import { IgxLinearGaugeModule } from 'igniteui-webcomponents-gauges/ES5/igx-linear-gauge-module';
import { IgxLinearGraphRange } from 'igniteui-webcomponents-gauges/ES5/igx-linear-graph-range';
import { IgxRadialGaugeComponent } from "igniteui-webcomponents-gauges/ES5/igx-radial-gauge-component";
import { IgxRadialGaugeModule } from "igniteui-webcomponents-gauges/ES5/igx-radial-gauge-module";
import { IgxRadialGaugeRange } from "igniteui-webcomponents-gauges/ES5/igx-radial-gauge-range";
import { SweepDirection } from "igniteui-webcomponents-core/ES5/SweepDirection";
// charts:
import { IgxFinancialChartComponent } from "igniteui-webcomponents-charts/ES5/igx-financial-chart-component";
import { IgxFinancialChartModule } from "igniteui-webcomponents-charts/ES5/igx-financial-chart-module";
import { IgxDataChartComponent } from "igniteui-webcomponents-charts/ES5/igx-data-chart-component";
import { IgxDataChartCoreModule } from "igniteui-webcomponents-charts/ES5/igx-data-chart-core-module";
// maps:
import { IgxGeographicMapComponent } from "igniteui-webcomponents-maps/ES5/igx-geographic-map-component";
import { IgxGeographicMapModule } from "igniteui-webcomponents-maps/ES5/igx-geographic-map-module";
 GitHub