Thank you for your feedback! You have rated this topic in the last 30 days.
Creating an Image View
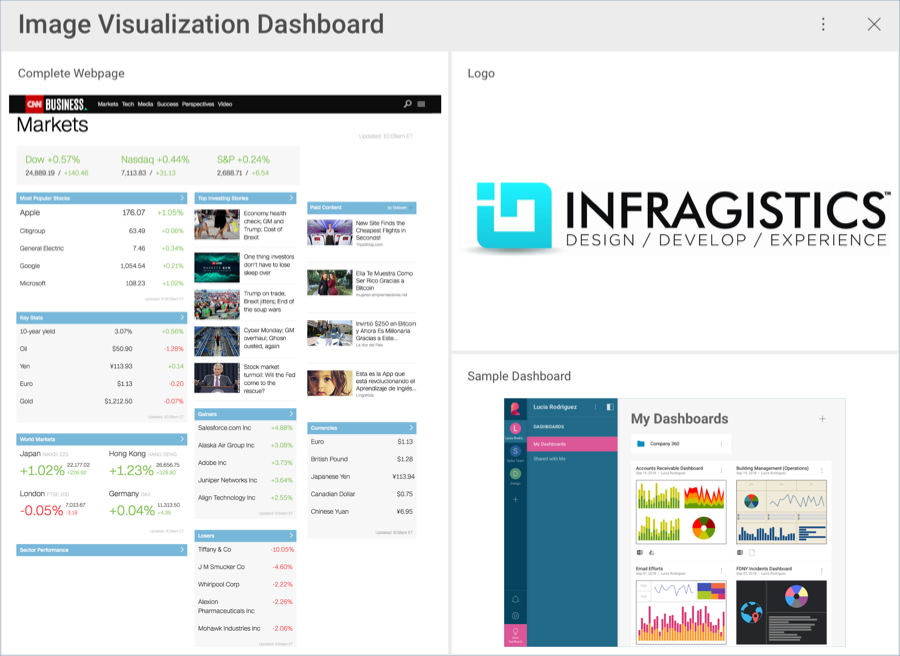
In this tutorial, you will learn how to create an Image visualization using a sample spreadsheet.
Key Concepts
As mentioned in the Data Visualization section, the Image View displays information in an embedded browser by making a request to a URL and displaying the results. The data source, therefore, will need to:
Include a link to a web resource to be displayed in the widget.
Excel files as local files are not supported in this release. In order to follow these tutorials, make sure you upload the file to one of the supported cloud services or add it as a Web Resource.
Creating an Image View
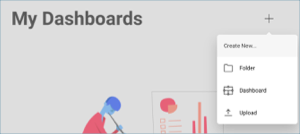
1. Create a Dashboard
In the dashboard viewer, select the + button in the top right-hand corner of the "My Dashboards" screen. Then, select "Dashboard" from the dropdown.
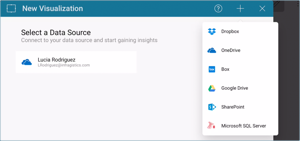
2. Configure your Data Source
In the New Visualization window, select the + button in the bottom right corner and select your data source.
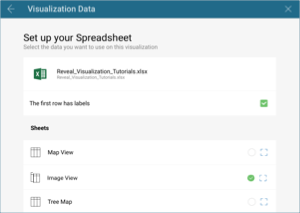
3. Select the Tutorials Spreadsheet
Once the data source is configured, select the Reveal Tutorials Spreadsheet. Then, choose the "Image View" sheet.
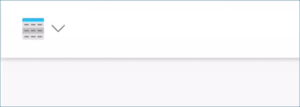
4. Open the Visualizations Menu
Select the grid icon in the top bar of the Visualizations Editor.
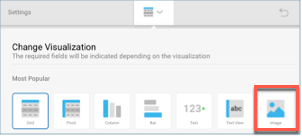
5. Select your Visualization
By default, the visualization type will be set to "Grid". Select the Image option.
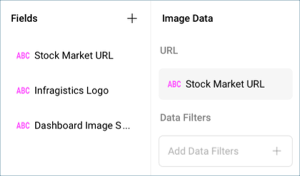
6. Organize your Data
Drag any of the available fields into URL.
This page has encountered an error. We've attempted to send the information to the server.