In this tutorial, you will learn how to create stacked chart visualizations using a sample spreadsheet.
Access the links below for the Stacked Chart view walkthroughs:
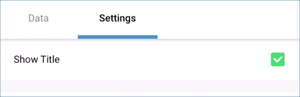
You can also configure the following settings:
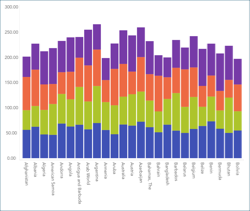
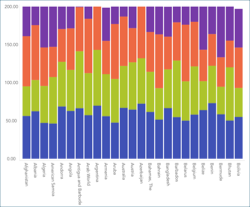
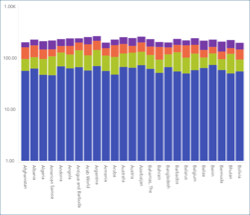
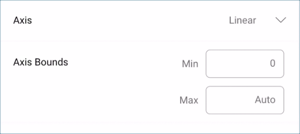
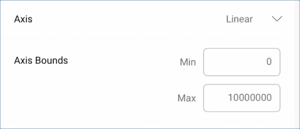
Axis Configuration: the axis configuration lets you configure the minimum and maximum values for your charts. The minimum value is set to 0 by default and the maximum calculated automatically depending on your values.
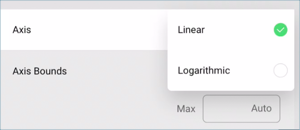
Logarithmic Axis Configuration: if you check the "Logarithmic" checkbox, the scale for your values will be calculated with a non-linear scale which takes magnitude into account instead of the usual linear scale.
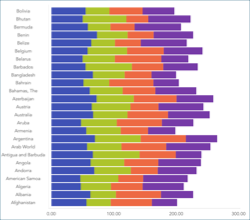
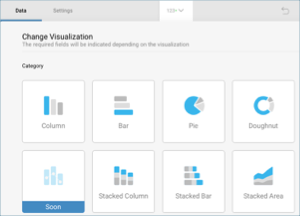
If needed, you can choose a different type of stacked chart better fitted to your needs. In order to do this:
Similarly to the Gauge bands, the chart axis configuration allows you to set the lowest and highest values in your chart. You can use this feature to include or exclude specific data.
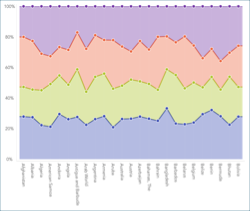
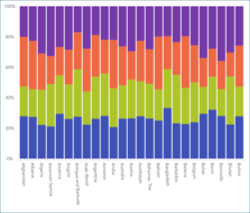
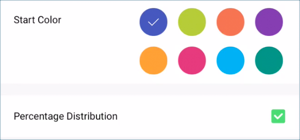
For stacked charts, you can configure the Percentage Distribution. It allows you to switch between values and percentage distribution scales for those types of charts. In order to do this: