Version

Creating a Text View

In this tutorial, you will learn how to create a text view visualization using a sample spreadsheet.

TextViewSample_All

Access the links below for the Text view walkthroughs.


Key Concepts

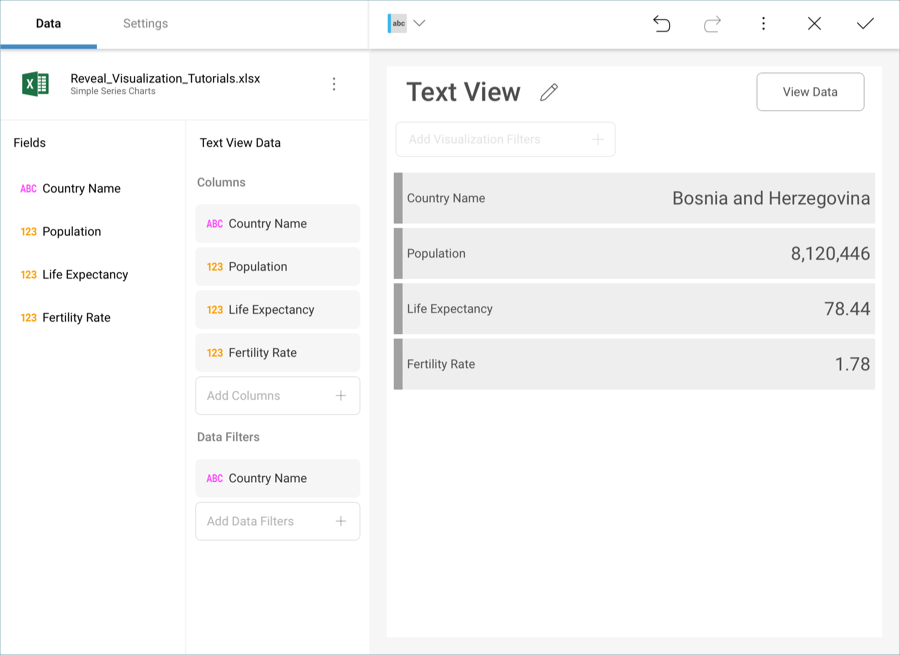
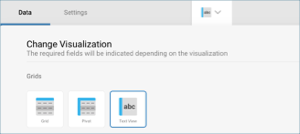
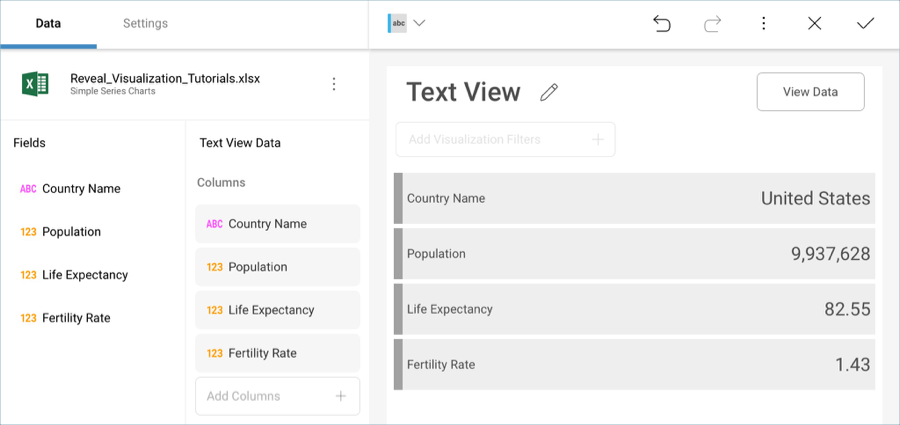
Text views display information in a key-value pattern, but they only display the first row of data paired with a column’s label. You can, however, add filters to make sure Reveal displays the row you need.


Sample Data Source

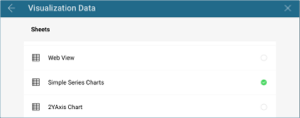
For this tutorial, you will use the "Simple Series Charts" sheet in the Reveal Tutorials Spreadsheet.

Note
NOTE

Excel files as local files are not supported in this release. In order to follow these tutorials, make sure you upload the file to one of the supported cloud services or add it as a Web Resource.


Creating a Text View

1. Create a Dashboard

Tutorials-Create-New-Dashboard

In the dashboard viewer, select the + button in the top right-hand corner of the "My Dashboards" screen. Then, select "Dashboard" from the dropdown.

2. Configure your Data Source

Tutorials-Select-Data-Source

In the New Visualization window, select the + button in the bottom right corner and select your data source.

3. Select the Tutorials Spreadsheet

Tutorials-Select-Simple-Series-Charts-Spreadshee

Once the data source is configured, select the Reveal Tutorials Spreadsheet. Then, choose the "Simple Series Charts" sheet.

4. Open the Visualizations Menu

Tutorials-Select-Change-Visualization

Select the grid icon in the top bar of the Visualizations Editor.

5. Select your Visualization

Tutorials-Charts-Select-Text-View

By default, the visualization type will be set to "Grid". Select the Text View.

6. Organize your Data

Tutorials-TextView-Organizing-Data

The above text view, for example, displays the population, life expectancy, and fertility rate for a specific country. Drag and drop "Country Name", "Population", "Life Expectancy" and "Fertility Rate" into Columns.

Changing the Selected Row

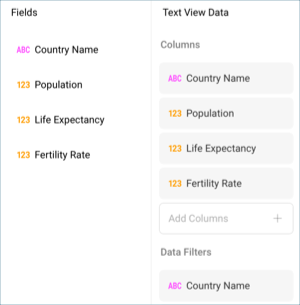
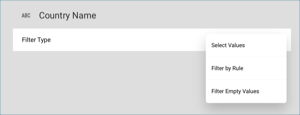
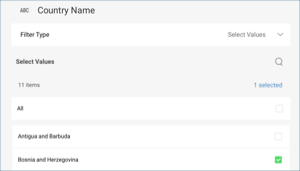
Text View display the first row of the sheet by default. You can add a filter to your data in order to change this. For example, let’s make the text view display row 9 (Bosnia and Herzegovina).

1. Add a Data Filter

SelectFieldTextView_All

Drag and drop the "Country Name" field into Data Filters.

2. Set your Filter

SelectedValuesTextView_All

Select "Filter Type" to enable the dropdown menu, and then choose Select Values.

3. Select your Value

SelectValueTextView2_All

By default, all values will be selected. Uncheck the "All" box, and select only Bosnia and Herzegovina. Then, select Create Filter

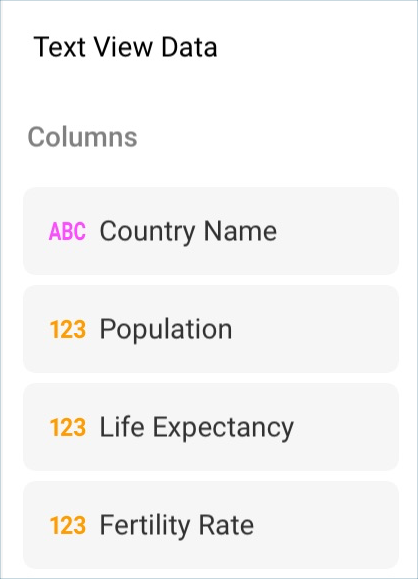
Your visualization will look like the following one:

TutorialSelectedRowTextView_All