
Exporting many charts to one Portable Document Format (PDF) file is a common scenario. This walkthrough will show you how to:
export four charts to one PDF file
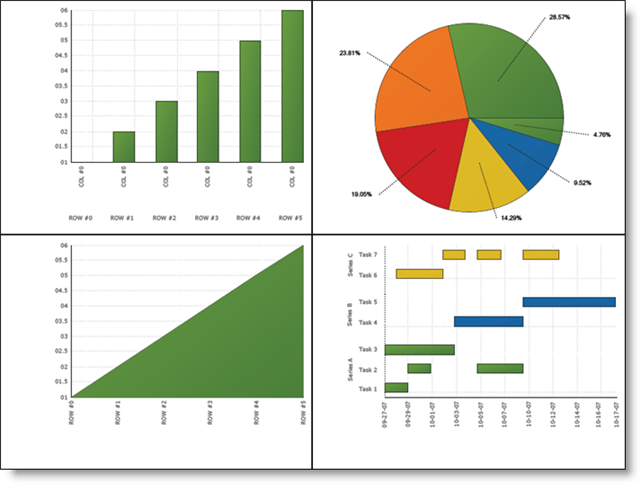
position the charts within the PDF file
When you save and run your application after completing the following steps, your PDF should look similar to the following image:
Export numerous charts to one PDF:
Add a reference to Infragistics4.Documents.Reports.v23.2 to your project.
Create the form’s Load event handler and add the following code to it.
Create a new report and add a page to it.
In Visual Basic:
Dim reportPath As String = _
    System.Environment.GetFolderPath( _
     System.Environment.SpecialFolder.MyDocuments)
UltraChart1.Size = New Size(400, 300)
Dim report As New Report()
Dim page As ISectionPage = report.AddSection().AddPage()
page.Width = 800
page.Height = 600
In C#:
string reportPath =
  System.Environment.GetFolderPath(System.Environment.SpecialFolder.MyDocuments);
ultraChart1.Size =  new Size(400, 300);
Report report = new Report();
ISectionPage page = report.AddSection().AddPage();
page.Width = 800;
page.Height = 600;
Create the first chart. Set the chartType to ColumnChart and bind it to an array of data.
In Visual Basic:
UltraChart1.ChartType = ChartType.ColumnChart
UltraChart1.Data.DataSource = New Integer() {1, 2, 3, 4, 5, 6}
UltraChart1.Data.DataBind()
In C#:
ultraChart1.ChartType = ChartType.ColumnChart;
ultraChart1.Data.DataSource = new int[] { 1, 2, 3, 4, 5, 6 };
ultraChart1.Data.DataBind();
Create a new canvas and render the column chart to the canvas graphics.
In Visual Basic:
Dim canvas As ICanvas = page.AddCanvas(0, 0)
canvas.Width = New FixedWidth(400)
canvas.Height = New FixedHeight(300)
Dim g As Graphics = canvas.CreateGraphics()
UltraChart1.RenderPdfFriendlyGraphics(g)
In C#:
ICanvas canvas = page.AddCanvas(0, 0);
canvas.Width = new FixedWidth(400);
canvas.Height = new FixedHeight(300);
Graphics g = canvas.CreateGraphics();
ultraChart1.RenderPdfFriendlyGraphics(g);
Create the second chart. Set the chartType to PieChart and bind it to an array of data.
In Visual Basic:
UltraChart1.ChartType = ChartType.PieChart
UltraChart1.Data.DataSource = New Integer() {1, 2, 3, 4, 5, 6}
UltraChart1.Data.DataBind()
In C#:
ultraChart1.ChartType = ChartType.PieChart;
ultraChart1.Data.DataSource = new int[] { 1, 2, 3, 4, 5, 6 };
ultraChart1.Data.DataBind();
Create another canvas at a different location and render the pie chart.
In Visual Basic:
canvas = page.AddCanvas(400, 0)
canvas.Width = New FixedWidth(400)
canvas.Height = New FixedHeight(300)
g = canvas.CreateGraphics()
UltraChart1.RenderPdfFriendlyGraphics(g)
In C#:
canvas = page.AddCanvas(400, 0);
canvas.Width = new FixedWidth(400);
canvas.Height = new FixedHeight(300);
g = canvas.CreateGraphics();
ultraChart1.RenderPdfFriendlyGraphics(g);
Create the third chart. Set the chartType to AreaChart and bind it to an array of data.
In Visual Basic:
UltraChart1.ChartType = ChartType.AreaChart
UltraChart1.Data.DataSource = New Integer() {1, 2, 3, 4, 5, 6}
UltraChart1.Data.SwapRowsAndColumns = True
UltraChart1.Data.DataBind()
In C#:
ultraChart1.ChartType = ChartType.AreaChart;
ultraChart1.Data.DataSource = new int[] { 1, 2, 3, 4, 5, 6 };
ultraChart1.Data.SwapRowsAndColumns = true;
ultraChart1.Data.DataBind();
Create another canvas at a different location and render the area chart.
In Visual Basic:
canvas = page.AddCanvas(0, 300)
canvas.Width = New FixedWidth(400)
canvas.Height = New FixedHeight(300)
g = canvas.CreateGraphics()
UltraChart1.RenderPdfFriendlyGraphics(g)
In C#:
canvas = page.AddCanvas(0, 300);
canvas.Width = new FixedWidth(400);
canvas.Height = new FixedHeight(300);
g = canvas.CreateGraphics();
ultraChart1.RenderPdfFriendlyGraphics(g);
Create the fourth chart. Set the chartType to GanttChart and bind it to a demo table of data.
In Visual Basic:
UltraChart1.ChartType = ChartType.GanttChart
UltraChart1.Data.SwapRowsAndColumns = False
UltraChart1.Data.DataSource = Infragistics.UltraChart.Data.DemoTable.Table(4)
UltraChart1.Data.DataBind()
In C#:
ultraChart1.ChartType = ChartType.GanttChart;
ultraChart1.Data.SwapRowsAndColumns = false;
ultraChart1.Data.DataSource = Infragistics.UltraChart.Data.DemoTable.Table(4);
ultraChart1.Data.DataBind();
Create another canvas at a different location and render the gantt chart.
In Visual Basic:
canvas = page.AddCanvas(400, 300)
canvas.Width = New FixedWidth(400)
canvas.Height = New FixedHeight(300)
g = canvas.CreateGraphics()
UltraChart1.RenderPdfFriendlyGraphics(g)
In C#:
canvas = page.AddCanvas(400, 300);
canvas.Width = new FixedWidth(400);
canvas.Height = new FixedHeight(300);
g = canvas.CreateGraphics();
ultraChart1.RenderPdfFriendlyGraphics(g);
Publish the report.
In Visual Basic:
report.Publish(reportPath + "\Report.pdf", FileFormat.PDF)
In C#:
report.Publish(reportPath + "\\Report.pdf", FileFormat.PDF);
Save and run your application