
Any set of numbers (data) has various attributes that can be shown through charting. One attribute is data range. Other attributes are data minimum and data maximum. When charting a set of numbers (data) these attributes play an important role. Normally, a chart is created using the following steps:
Find the minimum and maximum of the data, so that the range is known.
Draw an axis which reaches from the lower end ( data minimum ) to the upper end ( data maximum ).
Draw tick marks on this line at consistent intervals.
Draw numbers on the line, using the relative position from the lower end ( data minimum ) of the axis.
This simple process is repeated with another axis to draw the chart. When the number of data items or the data range is too large, some of the charted items will not appear. For example:
the data range is 2000; and
the chart’s height is approximately 200 pixels.
In the above-mentioned example, any data item less than 10 will occupy a pixel or less, and will never show up on the chart. For such scenarios, Chart provides scrolling and scaling. With scaling we can actually zoom in and observe the smaller data points that will not show up normally. With scrolling, the end user can shift attention from one section to another by scrolling across an axis.
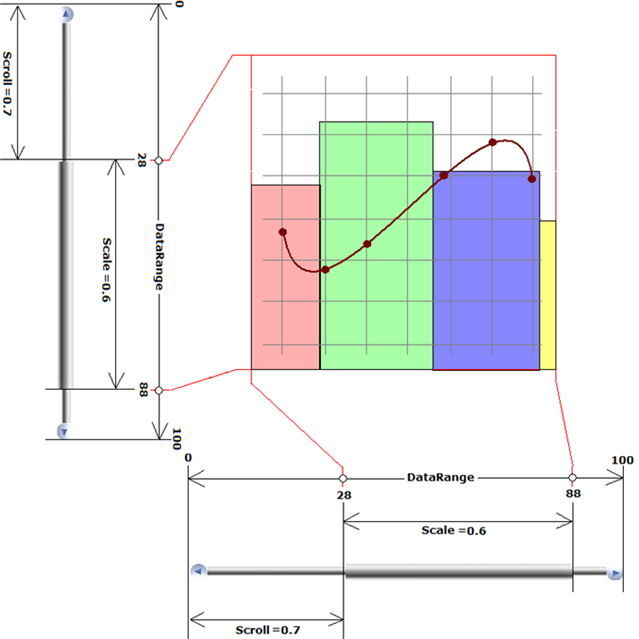
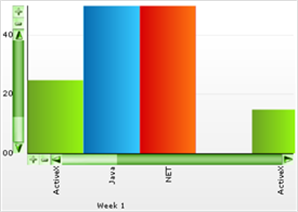
Scrolling and scaling allows the application developer and end user to control the data-window that is charted. In the above diagram, the data range is from 0 to 100 on both the axes, but the data window is only 60 units, from 28 to 88. The diagram also show how the Scroll and Scale properties of the axes affect the data window.
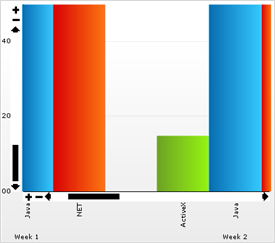
To enable the scrollbar, simply set the ScrollScale.Visible property of the appropriate axis to True.
When the scrollbar is enabled, the chart can be scrolled by user interaction (by clicking on the scroll bar buttons), or in code, using the following properties:
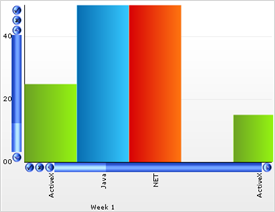
ScrollScale.Scale : a value between 0 and 1 which determines the fraction of the chart area which is visible at one time in the scroll window.
ScrollScale.Scroll : a value between 0 and 1 which determines the distance of the scroll bar across its track, where 0 is the bottom- or left-most point, and 1 is the top or right-most point in the scroll window.
ScrollScale.Width : determines the width for vertical scrollbars or height for horizontal scrollbars.
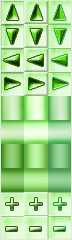
Chart scrollbars have appearances besides the default black & white scroll bar:
To achieve this, skins are used. Scrollbar skins are actually complete images that are cut into pieces to make the chart scrollbars. For examples of scroll bar skins, use the image files located in the following folder:
C:\Users\Public\Documents\Infragistics\2023.2\Windows Forms\Samples\Legacy\Chart\Data\images\scrollbar_images
You can create your own custom scroll bar skins; simply use the images located in the above-mentioned folders as a model for creating your own scrollbar image.