Version

Axis Tickmarks

Tick marks display points on the axes. They represent a certain numeric point on a scale or the value of the underlying data item in a category axis.

In this topic

This topic contains the following sections:

Property Settings

In the UltraCategoryChart control, you can change the length, thickness, and color of the x-axis and y-axis tickmarks using the following properties:

Property Name Property Type Description

double

Determines the length of the tickmark along the x-axis or y-axis.

double

Determines the thickness of of the tickmark along the x-axis or y-axis

Code Snippet

The following code snippet demonstrates how to set the color, length and thickness of the tickmark on the x-axis.

In C#:

this.ultraCategoryChart1.ChartType = CategoryChartType.Column;
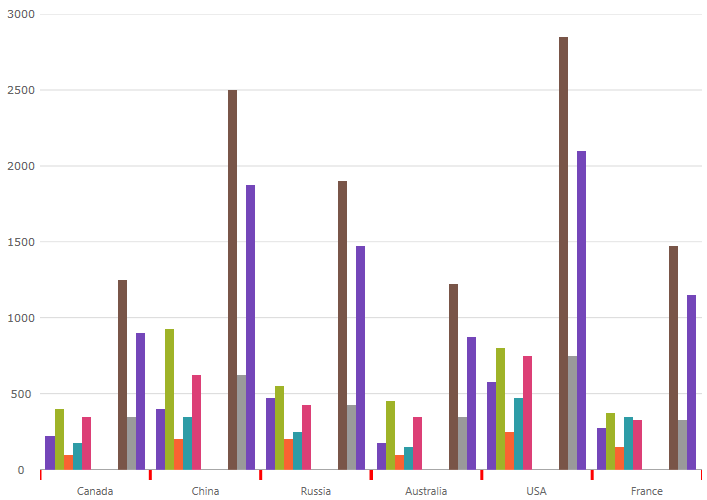
this.ultraCategoryChart1.XAxisTickLength = 7;
this.ultraCategoryChart1.XAxisTickStrokeThickness = 2;
this.ultraCategoryChart1.XAxisTickStroke = System.Drawing.Color.FromArgb(173, 37, 10, 0);

In Visual Basic:

Me.ultraCategoryChart1.ChartType = CategoryChartType.Column
Me.ultraCategoryChart1.XAxisTickLength = 7
Me.ultraCategoryChart1.XAxisTickStrokeThickness = 2
Me.ultraCategoryChart1.XAxisTickStroke = System.Drawing.Color.FromArgb(173, 37, 10, 0)
categorychart configuring axis tickmarks 01.png

Related Content

Topic Purpose

This article will get you up and running with the Category Chart control.

This article describes the available chart types.