string[] inclusion = { "Country", "Hydro", "Nuclear" };
chart1.IncludedProperties = inclusion;
This topic explains, with code examples, how to configure which properties are displayed in the UltraCategoryChart control.
By default, the UltraCategoryChart will plot all properties that exist on the underlying data items in the bound ItemsSource collection. This topic will inform you on how to pick which properties are plotted in the chart.
The following topics are prerequisites to understanding this topic:
This topic contains the following sections:
You can include and exclude properties from the UltraCategoryChart by setting the following properties:
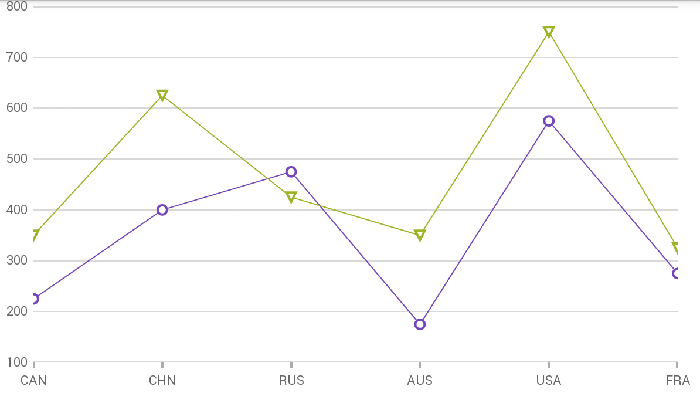
The following code example uses the Energy Data Source sample code as its DataSource and shows how to achieve the following chart both by including and excluding properties.
In C#
string[] inclusion = { "Country", "Hydro", "Nuclear" };
chart1.IncludedProperties = inclusion;In C#
string[] exclusion = { "Coal", "Oil", "Gas" };
chart1.ExcludedProperties = exclusion;
In Visual Basic
Dim inclusion As String() = {"Country", "Hydro", "Nuclear"}
chart1.IncludedProperties = inclusion
In Visual Basic
Dim inclusion As String() = {"Coal", "Oil", "Gas"}
chart1.ExcludedProperties = exclusion