
In Ultimate UI for WPF, this topic explains how the Value Overlay, Value Layer, and Chart Annotation Layers can show custom overlay text in the XamDataChart component. While these annotations and overlay layers are often used to annotate important events (e.g. company quarter reports) on x-axis or important values on y-axis in relationship to the series shown, these can be further annotated with overlay text.
For example, you can use DataAnnotationSliceLayer, ValueOverlay, and ValueLayer to show overlay text.
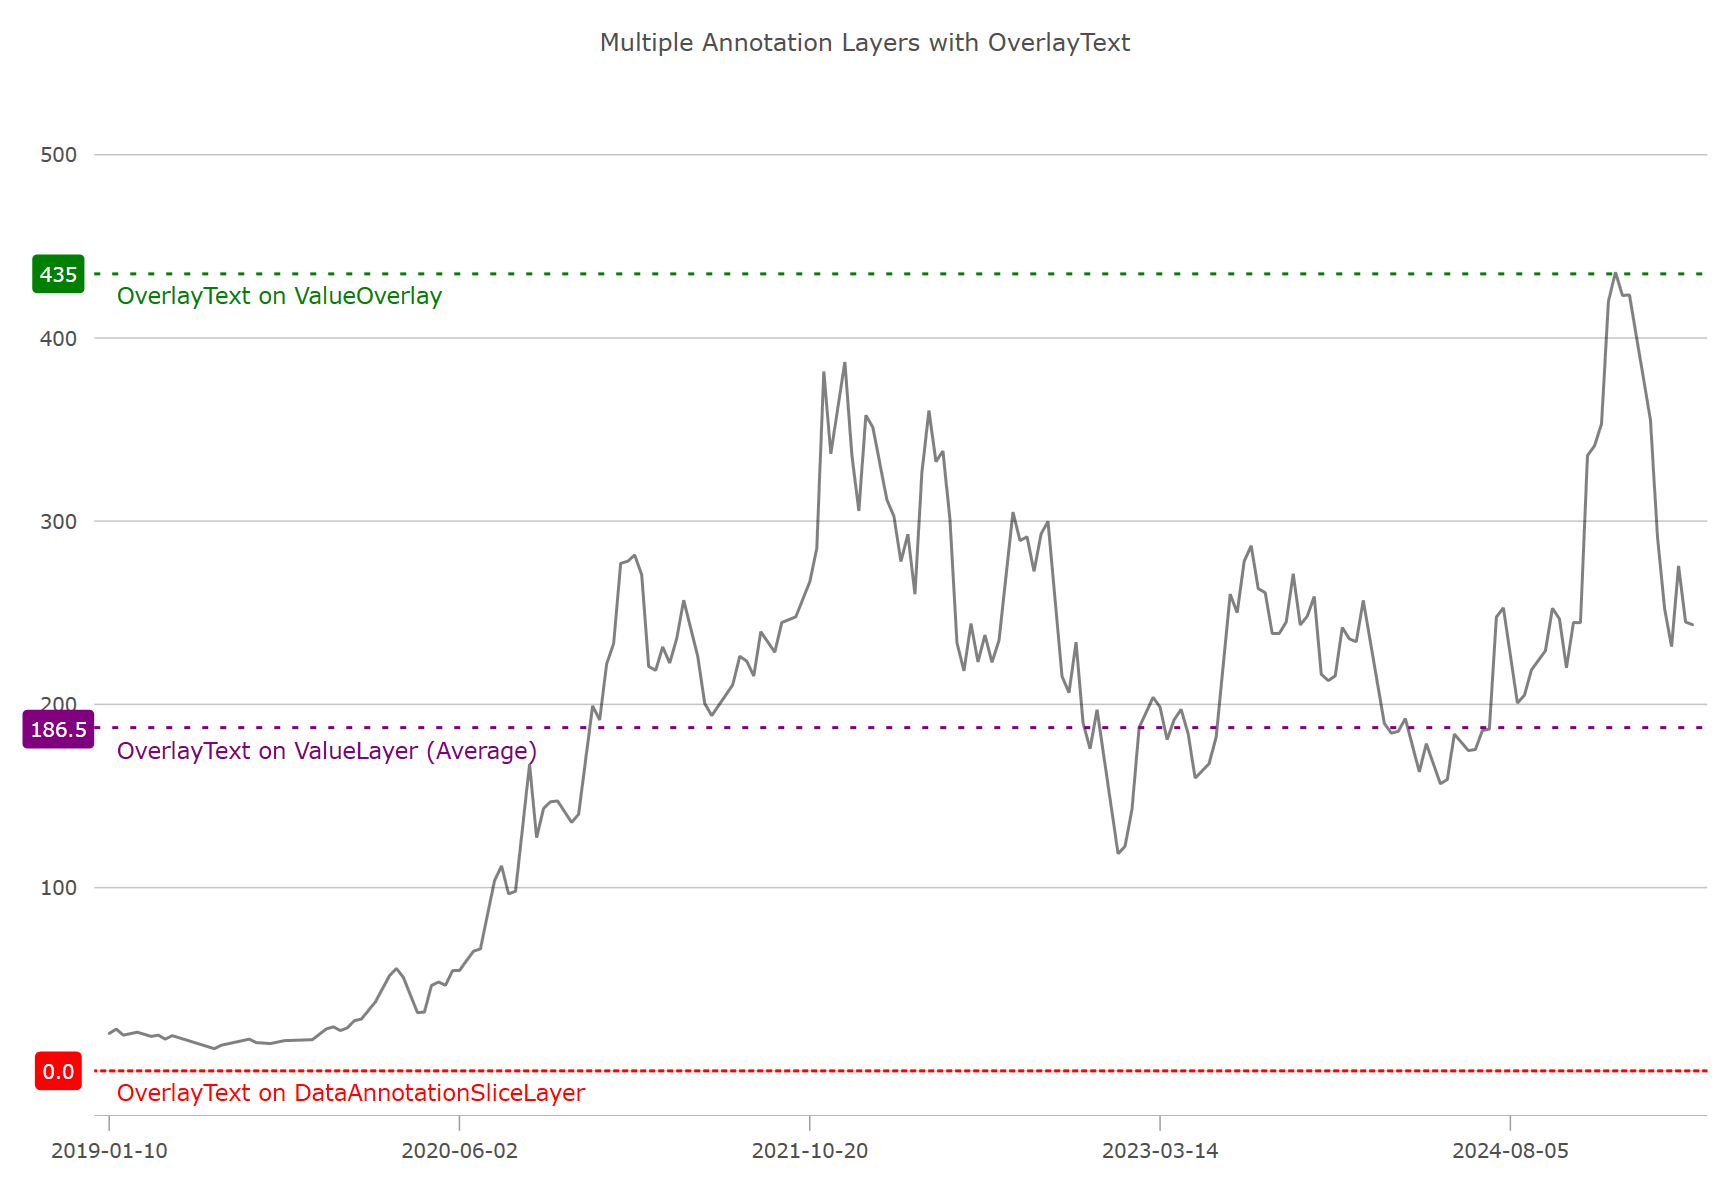
The following code snippet demonstrates how to render a comparison of three annotation layers as shown in the picture above.
In XAML:
<ig:DataAnnotationSliceLayer
AnnotationValueMemberPath="Value"
AnnotationLabelMemberPath="Label"
OverlayTextLocation="OutsideBottomLeft"
OverlayText="OverlayText on DataAnnotationSliceLayer"
TargetAxis="{Binding ElementName=yAxis}"
IsAxisAnnotationEnabled="true"
ItemsSource="{Binding}"
/>
In C#:
var yAxis = new NumericYAxis
{
    MinimumValue = 0,
    MaximumValue = 550,
    LabelExtent = 60,
    LabelMargin = new Padding(0, 0, 5, 0),
    LabelHorizontalAlignment = Portable.Components.UI.HorizontalAlignment.Center,
};

var sliceLayer = new DataAnnotationSliceLayer()
{
    DashArray = new DoubleCollection { 2, 4 },
    Brush = Brushes.Red,
    TargetMode = DataAnnotationTargetMode.NumericYAxes,
    Name = "AnnoLayer",
    Thickness = 2,
    OverlayText = "OverlayText on DataAnnotationSliceLayer",
    OverlayTextLocation = OverlayTextLocation.OutsideBottomLeft,
    AnnotationLabelMemberPath = "Label",
    AnnotationValueMemberPath = "Value",
    DataSource = new List<Annotation> { new Annotation() { Value = 0, } }
};

// Create the ValueOverlay
var valueOverlay = new ValueOverlay()
{
    Value = 435,
    Brush = Brushes.Green,
    IsAxisAnnotationEnabled = true,
    Thickness = 2,
    DashArray = new DoubleCollection { 2, 4 },
    Axis = yAxis,
    OverlayText = "OverlayText on ValueOverlay",
    OverlayTextLocation = OverlayTextLocation.OutsideBottomLeft
};

// Create the ValueLayer
var valueLayer = new ValueLayer()
{
    ValueMode = ValueLayerValueMode.Average,
    Brush = Brushes.Purple,
    Thickness = 2,
    DashArray = new DoubleCollection { 2, 4 },
    IsAxisAnnotationEnabled = true,
    OverlayText = "OverlayText on ValueLayer (Average)",
    OverlayTextLocation = OverlayTextLocation.OutsideBottomLeft
};

chart.Series.Add(valueOverlay);
chart.Series.Add(valueLayer);
chart.Axes.Add(xAxisBottom);
chart.Series.Add(sliceLayer);This code example shows how to style and customize Overlay Text on the Value Overlay, Value Layer, and Chart Annotation Layers
In C#:
public Series StylingOverlayText()
{
    var annoLayer = new DataAnnotationSliceLayer();

    // styling optional overlay text
    annoLayer.OverlayTextColor = Brushes.White;
    annoLayer.OverlayTextBackground = Brushes.Green;
    annoLayer.OverlayTextBorderColor = Brushes.Black;
    annoLayer.OverlayTextBorderThickness = 1;
    annoLayer.OverlayTextBorderRadius = 4;
    annoLayer.OverlayTextHorizontalMargin = 5;
    annoLayer.OverlayTextHorizontalPadding = 2;
    annoLayer.OverlayTextVerticalMargin = 5;
    annoLayer.OverlayTextVerticalPadding = 2;

    return annoLayer;
}