<ig:XamFinancialChart x:Name="chart1"
    XAxisLabelFontSize="16"
    XAxisLabelForeground="Blue"
    XAxisLabelFontWeight="Bold"
    YAxisLabelFontSize="16"
    YAxisLabelForeground="Green"
    YAxisLabelFontWeight="Bold">
</ig:XamFinancialChart>
The XamFinancialChart control allows you full control over configuring, formatting and styling the labels displayed along the x-axis and y-axis on your chart. By default, you do not need to explicitly set the labels.
This topic contains the following sections:
In the XamFinancialChart control, you can change the rotation angle, margin, horizontal/vertical alignment, opacity, padding and visibility, of the x-axis and y-axis labels using the following properties:
The look and feel of the financial chart’s x-axis and y-axis labels can be styled in many aspects, the main of which are applying different font styles such as font type, font size, font weight, and colors to the labels. This can be achieved through the following properties:
The XamFinancialChart control allows you to specify if the y-axis labels should display abbreviated numeric values on the y-axis. For label values that may appear too long, you can set YAxisAbbreviateLargeNumbers to true to enable this feature. This is set to true by default.
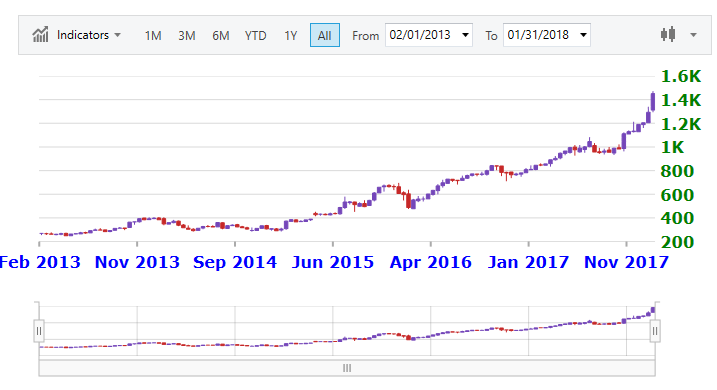
The following code example shows how to style labels on the x-axis using date formatting and other style properties:
In XAML:
<ig:XamFinancialChart x:Name="chart1"
XAxisLabelFontSize="16"
XAxisLabelForeground="Blue"
XAxisLabelFontWeight="Bold"
YAxisLabelFontSize="16"
YAxisLabelForeground="Green"
YAxisLabelFontWeight="Bold">
</ig:XamFinancialChart>In C#:
var chart1 = new XamFinancialChart()
chart1.XAxisLabelFontSize = 16;
chart1.XAxisLabelForeground = new SolidColorBrush(Colors.Blue);
chart1.XAxisLabelFontWeight = FontWeights.Bold;
chart1.YAxisLabelFontSize = 16;
chart1.YAxisLabelForeground = new SolidColorBrush(Colors.Green);
chart1.YAxisLabelFontWeight = FontWeights.Bold;
In Visual Basic:
Dim chart1 = New XamFinancialChart()
chart1.XAxisLabelFontSize = 16
chart1.XAxisLabelForeground = New SolidColorBrush(Colors.Blue)
chart1.XAxisLabelFontWeight = FontWeights.Bold
chart1.YAxisLabelFontSize = 16
chart1.YAxisLabelForeground = New SolidColorBrush(Colors.Green)
chart1.YAxisLabelFontWeight = FontWeights.Bold
The following screenshot demonstrates the XamFinancialChart control with the axis labels formatted and styled.