
This topic demonstrates how to bind data to the XamPieChart™ control. At the end of the topic, a complete code sample is provided.
The topic is organized as follows:
The procedure below demonstrates how to bind the XamPieChart control to a data collection. You will define a data collection, add the Pie Chart control to your application, and then bind the control’s ItemsSource to an instance of the data collection.
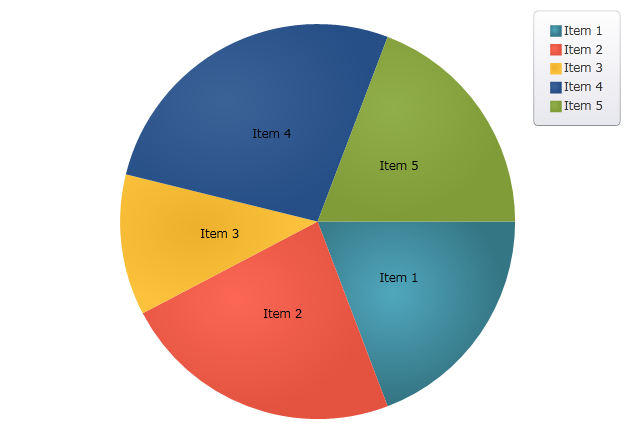
Figure 1: The XamPieChart control as implemented by the sample code
Add the following NuGet package to your main project:
Infragistics.WPF.Charts
For more information on setting up the NuGet feed and adding NuGet packages, you can take a look at the following documentation: NuGet Feeds.
Also, add the following Infragistics namespaces:
In XAML:
xmlns:ig="http://schemas.infragistics.com/xaml"In C#:
using Infragistics.Controls.Charts;In VB:
Imports Infragistics.Controls.ChartsDefining a Data Model
Adding an Instance of the Pie Chart control
(Optional) Verifying the result
Define a Data Model.
Create a class to model the data. The following code creates a DataItem class representing simple value-label pairs, as well as a Data class representing a collection of those pairs:
In C#:
public class DataItem
{
    public string Label { get; set; }
    public double Value { get; set; }
}

public class Data : ObservableCollection<DataItem>
{
    public Data()
    {
        Add(new DataItem { Label = "Item 1", Value = 5 });
        Add(new DataItem { Label = "Item 2", Value = 6 });
        Add(new DataItem { Label = "Item 3", Value = 3 });
        Add(new DataItem { Label = "Item 4", Value = 7 });
        Add(new DataItem { Label = "Item 5", Value = 5 });
    }
}
In Visual Basic:
Public Class DataItem
   Public Property Label() As String
      Get
         Return _Label
       End Get
       Set
          _Label = Value
       End Set
    End Property
    Private _Label As String
    Public Property Value() As Double
       Get
          Return _Value
       End Get
       Set
          _Value = Value
       End Set
    End Property
    Private _Value As Double
End Class
Public Class Data
   Inherits ObservableCollection(Of DataItem)
   Public Sub New()
      Add(New DataItem() With { .Label = "Item 1", .Value = 5 })
      Add(New DataItem() With { .Label = "Item 2", .Value = 6 })
      Add(New DataItem() With { .Label = "Item 3", .Value = 3 })
      Add(New DataItem() With { .Label = "Item 4", .Value = 7 })
      Add(New DataItem() With { .Label = "Item 5", .Value = 5 })
   End Sub
 End Class
Add an instance of the XamPieChart Control.
To the layout root , add an instance of the data collection, a legend instance, and an instance of the Pie Chart:
In XAML:
    <Grid x:Name="LayoutRoot" >
        <Grid.Resources>
            <local:Data x:Key="data" />
        </Grid.Resources>
        <ig:ItemLegend x:Name="Legend"
                       Grid.Row="1"
                       VerticalAlignment="Top"
                       HorizontalAlignment="Right"  />
        <ig:XamPieChart Name="pieChart"
                       Grid.Row="2"
                       ItemsSource="{StaticResource data}"
                       LabelMemberPath="Label"
                       ValueMemberPath="Value"
                       Legend="{Binding ElementName=Legend}"/>
    </Grid>
(Optional) Verify the Result.
Run your application to verify the result. If you have successfully bound the Pie Chart control to the data collection, the resulting chart will look like the one shown in Figure 1, above.