We have added two new methods to the WorksheetColumn to support auto fit width.
The CalculateAutoFitWidth method returns the width required for a particular WorksheetColumn to fit all of its elements.
The AutoFitWidth method sizes the WorksheetColumn to the width returned by the CalculateAutoFitWidth method.
Conditional formatting allows you to automatically apply formatting — such as colors, icons, and data bars — to one or more cells based on the cell value. To do this, you’ll need to create a conditional formatting rule. For example, a conditional formatting rule might be if the value is less than $2000, color the cell red. By applying this rule, you would be able to quickly see which cells contain values less than $2000.
We already had support in our engine for sorting and filtering within a WorksheetTable. Excel also has the ability to define a single area within the worksheet outside of a table that you can do sorting and filtering within and you can also define one other area within a worksheet that is sorted. Therefore, we added support for these worksheet level sorting and filtering operations to our Excel Engine. In addition we made the icon sorting/filtering classes public. Previously these were internal because the only way to specify an icon is via an iconset conditional format and we didn’t support conditional formatting.
For Infragistics UltraSpreadsheet you can find more information here: UltraSpreadsheet Sorting.
For Infragistics Excel Engine you can find more information here Infragistics Excel Engine Sorting.
The Excel engine now has over 100 supported functions. See the list here
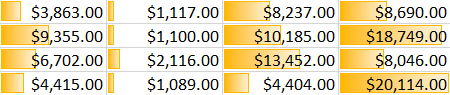
With the addition of the conditional formatting feature in the Excel Engine, we can now leverage this in the spreadsheet. The spreadsheet supports rendering all conditional formatting features available in Microsoft Excel. Microsoft Excel has several predefined styles — or presets — you can use to quickly apply conditional formatting to your data. They are grouped into three categories:
Data Bars are horizontal bars added to each cell, much like a bar graph.
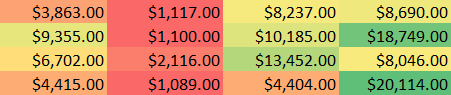
Color Scales change the color of each cell based on its value. Each color scale uses a two- or three-color gradient. For example, in the Green-Yellow-Red color scale, the highest values are green, the average values are yellow, and the lowest values are red.
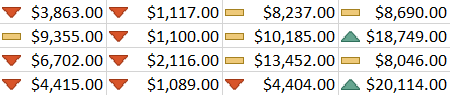
Icon Sets add a specific icon to each cell based on its value.
Note: Conditional formatting will be copied when copying/pasting within the spreadsheet.
By filtering information in a worksheet, you can find values quickly. You can filter on one or more columns of data. With filtering, you can control not only what you want to see, but what you want to exclude. You can filter based on choices you make from a list, or you can create specific filters to focus on exactly the data that you want to see. When you filter data, entire rows are hidden if values in one or more columns don’t meet the filtering criteria. You can filter on numeric or text values, or filter by color for cells that have color formatting applied to their background or text.
Filtering options are available on the context menu of cells in the UltraSpreadsheet. After applying a filter, users can select the Custom Filter… option in the filter dropdown to open a dialog that has even more filtering options.
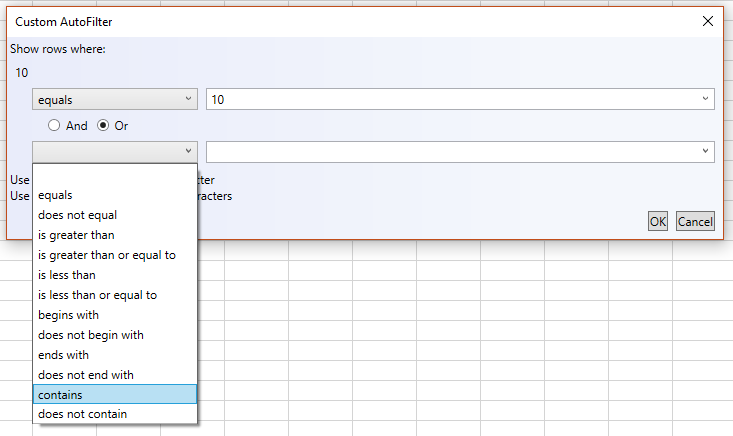
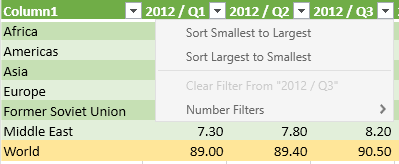
The headers of a WorksheetTable and the header cells of the worksheet level filtering region will display a dropdown button that displays the filter related menu. The buttons show the sort and filter state and the tooltip displays a friendly description of the filter for that column. The menu displays various options for sorting and filtering. The filter options displayed are dependent on the data types in the column as they are in excel. So you’ll see one of the following:
Text Filters
Number Filters
Date Filters
Tables will now be copied when the source selection encompasses the entire table. So select an entire table (e.g. click in a cell, press ctrl+a two times), copy it to the clipboard and then paste elsewhere and a new copy of that table is created. Pasting within a WorksheetTable will automatically expand the table to encompass the area of the paste.
Typing/editing immediately adjacent to the bottom/right edge of a WorksheetTable will expand the table (in a separate undoable operation similar to what Excel does).
Tab Navigation within a table will navigate within the table wrapping to the next/previous row. Similar to Excel the table will also be automatically expanded when tabbing from the last visible cell of the table.
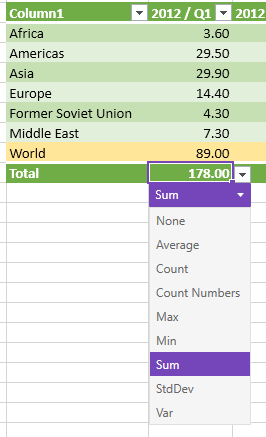
In Excel when a cell in total row of a table is active, a dropdown button is displayed that lets you choose a common formula for a table. We differ from Excel in that they include an option to show another dialog for other formulas but it’s still useful without that. It can be shown by clicking the dropdown button or pressing Alt+Down when the cell is active.
Additional context menu items were added. This includes menu items for inserting and adding rows and columns to the table, selecting the table row/column, toggling the total row, converting the table to a range, etc.
The table cell context menu is similar to the cell context menu except it is displayed when the active cell is part of a WorksheetTable. That menu also has a number of new commands that relate to affecting the table. Note there is now an ActiveTable exposed as well when the ActiveCell is part of a table.
In Excel you can define a special type of data validation called a list data validation that either contains an explicit list of values or points to a range of cells that contains the values. There is an option on that validation for whether to show a cell dropdown. The data validation class has been in our excel engine for a long time and the spreadsheet has honored using the validation during editing for a while now too but we never showed a list so the end users had to know the list of valid values. Now we support showing a dropdown button (when the ShowDropdown is true) that will display a drop down list of the values. It can be shown by clicking the dropdown button or pressing Alt+Down when the cell is active.
There are 2 ways to show the Cell Dropdown. One is via the context menu for a cell using the Pick From Drop-down List… item and the other is by pressing Alt+Down. This displays a dropdown of the text/string values immediately above and below the active cell. So you’re not explicitly defining the contents of the list like you do with a list data validation – it’s implicitly populated based on the cells above/below in the same manner as Excel. Note UltraSpreadsheet differs from Excel in that this dropdown will not be shown while in edit mode. As with Excel it ignores numerical values, stops at blanks and table boundaries, etc.
Two new events that occur when the grid column width is auto sized were added to the UltraGrid API.
BeforeAutoSizeColumn event occurs before the grid AutoSizes the width of a column and AfterAutoSizeColumn event occurs after the grid AutoSizes the width of a column.
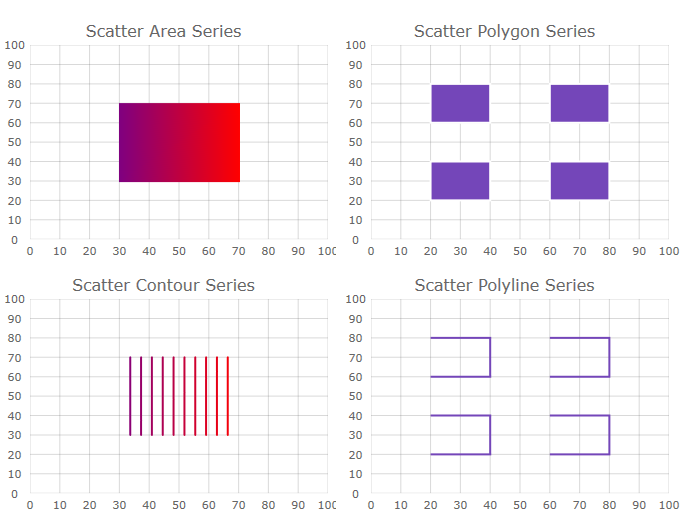
There are 4 new types of scatter series added to the UltraDataChart control. The following image show preview of these series, followed by a table with their description with links to topics that explain them in details.