
The Chart control lets you automatically choose the best possible range and interval for an axis based on the chart’s data and available space. By enabling this smart axis algorithm, you can avoid overlapping axis labels or hidden data in your chart.
Until now, this feature was available only to 2D charts. Starting in the 2006 Volume 2 release, you can now enable smart Tickmarks for 3D charts.
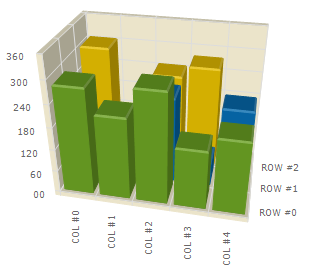
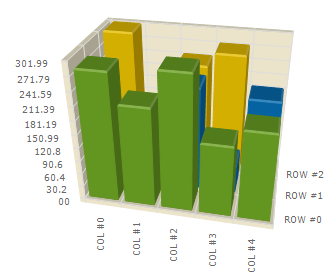
In the chart below (left), the smart tick mark style is not enabled for the 3D Column chart. Notice the unintuitive labels on the y-axis as a result of the data interval. The right chart below illustrates the same 3D chart with the Smart Tickmark style enabled. Now the problem of unintuitive y-axis labels has been eliminated!