
Tickmarks are the points at which labels are drawn on the axis. Additionally, the location of grid lines is controlled by the location of tickmarks. The distance between each tickmark on an axis can be customized using the TickmarkStyle , TickmarkInterval , and TickmarkPercentage properties of the axis.
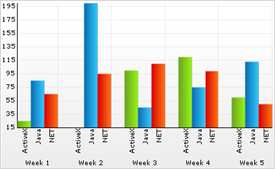
UltraChart1.Axis.Y.TickmarkStyle = AxisTickStyle.DataInterval
UltraChart1.Axis.Y.TickmarkInterval = 20.00
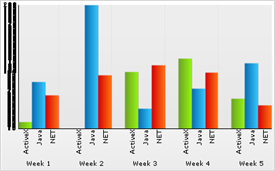
To print axis labels at every n percent of the axis length, set the TickmarkStyle to Percentage and set the value of the TickmarkPercentage property to n .
For tickmarks printed at data intervals:
For a numeric axis: to print axis labels at intervals of n, set the TickmarkStyle to DataInterval and set the value of the TickmarkInterval property to n .
For a SetLabelAxis object: to print every n th axis label, set the TickmarkStyle to DataInterval and set the value of the TickmarkInterval property to n .
For a date/time axis, see Display Labels at Intervals on a Time-Scale Axis for information.