Version

Configuring the Title/Subtitle (XamLinearGauge)

Purpose

This topic explains, with code examples, how to configure the title and subtitle of the XamLinearGauge™ control. This includes the title area width the start position of the text and the title/subtitle text itself.

Required background

The following topics are prerequisites to understanding this topic:

Topic Purpose

This topic provides conceptual information about the XamLinearGauge control including its main features, minimum requirements, and user functionality.

This topic explains how to add the XamLinearGauge control to a WPF application.

Configuring the Title/Subtitle

Title/subtitle configuration summary

The title of a XamLinearGauge control is typically used to identify what is being measured with it, i.e., its primary measure. The subtitle allows for providing additional details when this is deemed necessary. The title/subtitle are positioned inside the Title area of the control.

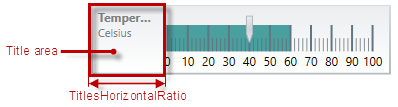
The Title area is the area in which the title/subtitle of the linear gauge is displayed. This area cannot overlap the scale (i.e. the Graph area).

Not set by default, when the linear gauge is oriented horizontally, the Title area configures its width automatically to fit the title and/or subtitle (whichever is longer). In addition to that, you can set the width of the Title area explicitly, a capability which comes handy when you have several XamLinearGauge controls placed on top of each other and you want their Title areas to have the same widths for a well-aligned look-and-feel.

For setting an explicit width of the Title area, the TitlesHorizontalRatio property is used.

XamLinearGauge Overview 4.png

Note that the Title area and the Graph area can be configured with swapped positions (i.e. the Graph area on the left and the Title area on the right at horizontal orientation): in this case, the Title area starts at the end of the scale so the Graph area begins at the edge of the control and ends where the Title area begins. The positions of the Graph area and the Title area are swapped with the TitlesPosition property.

Note
Note:

When the positions of the Graph area and the Title area are swapped in vertical orientation (the Graph area is above the Title area), then the title and the subtitle, too, swap their positions – the subtitle appears above the title.

Styles can be applied to the title/subtitle which allows for customizing their outer look.

Title/subtitle configuration summary chart

The following table explains briefly the configurable aspects of XamLinearGauge control’s title and subtitle and maps them to properties that configure them.

Configurable aspects Property Default value

Title area width (horizontal orientation only)

Not set

Title area position (relative to the Graph area)

TitlesPosition. ScaleStart

Title Text

null

Look-and-feel (configurable through style)

Not set

Subtitle Text

null

Look-and-feel (configurable through style)

Not set

Property settings

The following table maps the desired behavior to its respective property settings.

In order to configure: Details Use this property: And set it to:

Title area width (horizontal orientation only)

Width of the Title area. The area displays only the title/subtitle.

The desired value as a relative part of width of the control presented as a fraction of 1 (e.g. 0.2 )

Title area position (relative to the Graph area)

Position of the Title area on the left or on the right of the Graph area in horizontal orientation or at the top or the bottom in vertical orientation

Title Text

Text for the title of the graph.

The string to use for the graph title

Look-and-feel (configurable through style)

Formatting of the text for the title of the graph.

A style with a TargetType of TextBlock

Subtitle Text

Text for the subtitle of the graph.

A style with a TargetType of TextBlock

Look-and-feel (configurable through style)

Formatting of the text for the subtitle of the graph.

The string to use for the graph title

Example

The screenshot below demonstrates how the XamLinearGauge looks as a result of the following settings:

Property Value

“Temperature”

0.3

In XAML:

<Style x:Key="titleStyle" TargetType="TextBlock">
    <Setter Property="FontFamily" Value="Verdana"/>
    <Setter Property="FontSize" Value="11"/>
    <Setter Property="FontWeight" Value="Bold"/>
    <Setter Property="Foreground" Value="DarkBlue"/>
</Style>

“Celsius”

In XAML:

<Style x:Key="subtitleStyle" TargetType="TextBlock">
    <Setter Property="FontFamily" Value="Georgia"/>
    <Setter Property="FontSize" Value="11"/>
    <Setter Property="Foreground" Value="Blue"/>
</Style>
XamLinearGauge Configuring the Title Subtitle 1 17 1.png

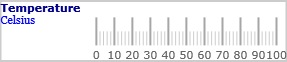
Following is the code that implements this example.

In XAML:

<ig:XamLinearGauge x:Name="linearGauge"
                   Height="70"
                   Width="300"
                   Title="Temperature"
                   TitleStyle="{StaticResource titleStyle}"
                   Subtitle="Celsius"
                   SubtitleStyle="{StaticResource subtitleStyle}"
                   TitlesHorizontalRatio="0.3"/>

Related Content

The following topics provide additional information related to this topic.

Topic Purpose

This topic explains, with examples, how to configure the scale of the XamLinearGauge control. This includes positioning the scale inside the control and configuring the scale tick marks and labels.

This topic explains, with code examples, how to configure the needle of the XamLinearGauge control. This includes the needle’s value, width, and formatting.

This topic explains, with code examples, how to configure ranges in the XamLinearGauge control. This includes the number of ranges and their positions, lengths, widths, and formatting.

This topic explains, with code examples, how to configure a background for the linear gauge. This includes setting the background’s size, position, color, and border.

This topic explains, with code examples, how to enable the tooltips in the XamLinearGauge control and configure the delay with which they are displayed.