

This topic explains how to configure the axes lines in the XamScatterSurface3D™ control.
The following topics are prerequisites to understanding this topic:
This topic contains the following sections:
Use the SurfaceChartAxis Stroke property to configure the axis line stroke in the xamScatterSurface3D control.
The following table maps the desired configuration to the property settings that manage it.
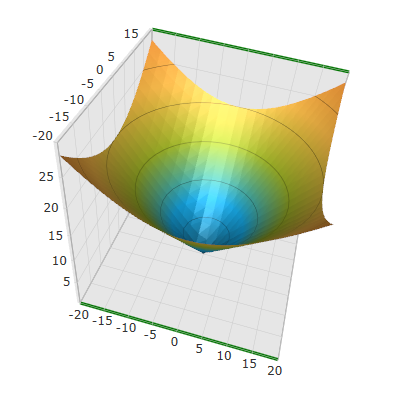
The screenshot below demonstrates how the axis line looks as a result of the following settings:
Following is the code that implements this example.
In XAML:
<ig:XamScatterSurface3D Name="SurfaceChart"
 ItemsSource="{Binding Path=DataCollection}"
 XMemberPath="X" YMemberPath="Y" ZMemberPath="Z"
 FloorMaterial="{x:Null}" ShowFloorProjection=">
    <ig:XamScatterSurface3D.XAxis>
       <ig:LinearAxis Stroke="Green" />
    </ig:XamScatterSurface3D.XAxis>
</ig:XamScatterSurface3D>
In C#:
…
var linearAxis = new LinearAxis();
linearAxis.Stroke = new SolidColorBrush(Colors.Green);
SurfaceChart.XAxis = linearAxis;
In Visual Basic:
…
Dim linearAxis = New LinearAxis()
linearAxis.Stroke = New SolidColorBrush(Colors.Green)
SurfaceChart.XAxis = linearAxisUse the SurfaceChartAxis StrokeThickness property to configure the axis line stroke thickness in the xamScatterSurface3D control.
The following table maps the desired configuration to the property settings that manage it.
The screenshot below demonstrates how the axis line looks as a result of the following settings:
Following is the code that implements this example.
In XAML:
<ig:XamScatterSurface3D Name="SurfaceChart"
 ItemsSource="{Binding Path=DataCollection}"
 XMemberPath="X" YMemberPath="Y" ZMemberPath="Z"
 FloorMaterial="{x:Null}" ShowFloorProjection=">
    <ig:XamScatterSurface3D.XAxis>
        <ig:LinearAxis Stroke="Green" StrokeThickness="3" />
    </ig:XamScatterSurface3D.XAxis>
</ig:XamScatterSurface3D>
In C#:
…
var linearAxis = new LinearAxis();
linearAxis.Stroke = new SolidColorBrush(Colors.Green);
linearAxis.StrokeThickness = 3;
SurfaceChart.XAxis = linearAxis;
In Visual Basic:
…
Dim linearAxis = New LinearAxis()
linearAxis.Stroke = New SolidColorBrush(Colors.Green)
linearAxis.StrokeThickness = 3
SurfaceChart.XAxis = linearAxisThe following topics provide additional information related to this topic.