
This topic explains the axis types available in the XamScatterSurface3D™ control.
The following topics are prerequisites to understanding this topic:
This topic contains the following sections:
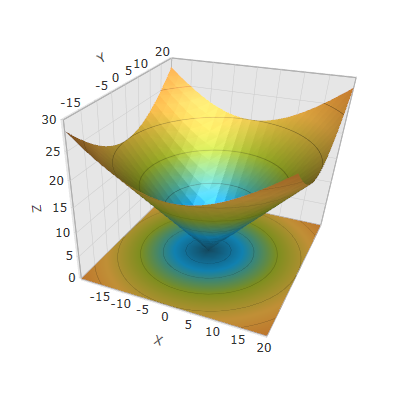
Use LinearAxis to apply a linear numeric scale in the xamScatterSurface3D control.
By default, the LinearAxis is applied on the data plotted in the xamScatterSurface3D control.
The following table maps the desired configuration to the property settings that manage it.
The screenshot below demonstrates how the xamScatterSurface3D control looks as a result of the following code:
Following is the code that implements this example.
In XAML:
<ig:XamScatterSurface3D Name="SurfaceChart"
 ItemsSource="{Binding Path=DataCollection}"
 XMemberPath="X" YMemberPath="Y" ZMemberPath="Z">
    <ig:XamScatterSurface3D.XAxis>
        <ig:LinearAxis Title="X" />
    </ig:XamScatterSurface3D.XAxis>
    <ig:XamScatterSurface3D.YAxis>
        <ig:LinearAxis Title="Y" />
    </ig:XamScatterSurface3D.YAxis>
    <ig:XamScatterSurface3D.ZAxis>
        <ig:LinearAxis Title="Z" />
    </ig:XamScatterSurface3D.ZAxis>
</ig:XamScatterSurface3D>
In C#:
…
var xLinearAxis = new LinearAxis();
var yLinearAxis = new LinearAxis();
var zLinearAxis = new LinearAxis();
xLinearAxis.Title = "X";
yLinearAxis.Title = "Y";
zLinearAxis.Title = "Z";
SurfaceChart.XAxis = xLinearAxis;
SurfaceChart.YAxis = yLinearAxis;
SurfaceChart.ZAxis = zLinearAxis;
In Visual Basic:
…
Dim xLinearAxis = New LinearAxis()
Dim yLinearAxis = New LinearAxis()
Dim zLinearAxis = New LinearAxis()
xLinearAxis.Title = "X"
yLinearAxis.Title = "Y"
zLinearAxis.Title = "Z"
SurfaceChart.XAxis = xLinearAxis
SurfaceChart.YAxis = yLinearAxis
SurfaceChart.ZAxis = zLinearAxisUse LogarithmicAxis to apply a logarithmic axis in the xamScatterSurface3D control.
The following table maps the desired configuration to the property settings that manage it.
The screenshot below demonstrates how the xamScatterSurface3D control looks as a result of the following code where the ZAxis is set to LogarithmicAxis:
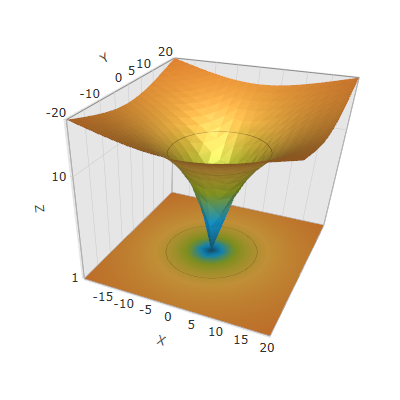
Following is the code that implements this example.
In XAML:
<ig:XamScatterSurface3D Name="SurfaceChart"
 ItemsSource="{Binding Path=DataCollection}"
 XMemberPath="X" YMemberPath="Y" ZMemberPath="Z">
    <ig:XamScatterSurface3D.XAxis>
        <ig:LinearAxis Title="X" />
    </ig:XamScatterSurface3D.XAxis>
    <ig:XamScatterSurface3D.YAxis>
        <ig:LinearAxis Title="Y" />
    </ig:XamScatterSurface3D.YAxis>
 <ig:XamScatterSurface3D.ZAxis>
        <ig:LogarithmicAxis Title="Z" />
    </ig:XamScatterSurface3D.ZAxis>
</ig:XamScatterSurface3D>
In C#:
…
var xLinearAxis = new LinearAxis();
var yLinearAxis = new LinearAxis();
var zLogarithmicAxis = new LogarithmicAxis();
xLinearAxis.Title = "X";
yLinearAxis.Title = "Y";
zLogarithmicAxis.Title = "Z";
SurfaceChart.XAxis = xLinearAxis;
SurfaceChart.YAxis = yLinearAxis;
SurfaceChart.ZAxis = zLogarithmicAxis;
In Visual Basic:
…
Dim xLinearAxis = New LinearAxis()
Dim yLinearAxis = New LinearAxis()
Dim zLogarithmicAxis = New LogarithmicAxis()
xLinearAxis.Title = "X"
yLinearAxis.Title = "Y"
zLogarithmicAxis.Title = "Z"
SurfaceChart.XAxis = xLinearAxis
SurfaceChart.YAxis = yLinearAxis
SurfaceChart.ZAxis = zLogarithmicAxisUse LogarithmBase to change the logarithmic axis base in the xamScatterSurface3D control.
By default, a common logarithm with base 10 is used in the xamScatterSurface3D control.
The following table maps the desired configuration to the property settings that manage it.
The screenshot below demonstrates how the xamScatterSurface3D control looks when the ZAxis is set to LogarithmicAxis with LogarithmBase set to 2:
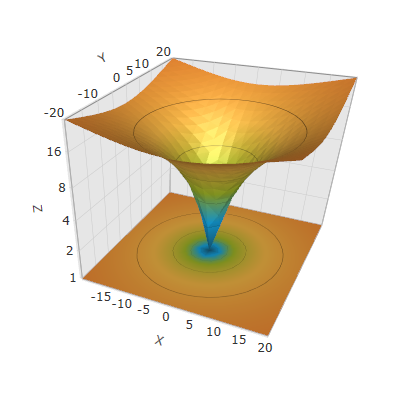
Following is the code that implements this example.
In XAML:
<ig:XamScatterSurface3D Name="SurfaceChart8"
 ItemsSource="{Binding Path=DataCollection}"
 XMemberPath="X" YMemberPath="Y" ZMemberPath="Z">
    <ig:XamScatterSurface3D.XAxis>
        <ig:LinearAxis Title="X" />
    </ig:XamScatterSurface3D.XAxis>
    <ig:XamScatterSurface3D.YAxis>
        <ig:LinearAxis Title="Y" />
    </ig:XamScatterSurface3D.YAxis>
 <ig:XamScatterSurface3D.ZAxis>
        <ig:LogarithmicAxis Title="Z"
 LogarithmBase="2" />
    </ig:XamScatterSurface3D.ZAxis>
</ig:XamScatterSurface3D>
In C#:
…
var xLinearAxis = new LinearAxis();
var yLinearAxis = new LinearAxis();
var zLogarithmicAxis = new LogarithmicAxis();
xLinearAxis.Title = "X";
yLinearAxis.Title = "Y";
zLogarithmicAxis.Title = "Z";
zLogarithmicAxis.LogarithmBase = 2;
SurfaceChart.XAxis = xLinearAxis;
SurfaceChart.YAxis = yLinearAxis;
SurfaceChart.ZAxis = zLogarithmicAxis;
In Visual Basic:
…
Dim xLinearAxis = New LinearAxis()
Dim yLinearAxis = New LinearAxis()
Dim zLogarithmicAxis = New LogarithmicAxis()
xLinearAxis.Title = "X"
yLinearAxis.Title = "Y"
zLogarithmicAxis.Title = "Z"
zLogarithmicAxis.LogarithmBase = 2
SurfaceChart.XAxis = xLinearAxis
SurfaceChart.YAxis = yLinearAxis
SurfaceChart.ZAxis = zLogarithmicAxisThe following topics provide additional information related to this topic.