Version

Configuring Axis Tick Marks Range

Purpose

This topic explains how to configure the axis tick marks range in the XamScatterSurface3D™ control.

Required background

The following topics are prerequisites to understanding this topic:

Topic Purpose

This topic provides detailed instructions to help you get up and running as soon as possible with the xamScatterSurface3D™ control.

This topic explains the features supported by the control from developer perspective.

This topic provides an overview of the visual elements of the control.

In this topic

This topic contains the following sections:

Configuring Axis Tick Marks Range

Overview

Use the LinearAxis TickmarkMinimumValue and TickmarkMaximumValue properties to set the axis tick marks range in the xamScatterSurface3D control.

Property settings

The following table maps the desired configuration to the property settings that manage it.

In order to: Use this property: And set it to:

Configure the minimum tick mark value

double

Configure the maximum tick mark value

double

Example

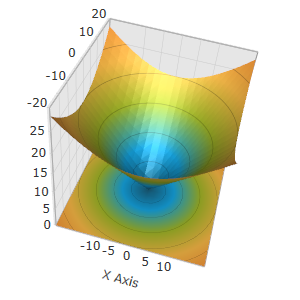
The screenshots and code snippets below demonstrates how the xamScatterSurface3D tick marks look by default and how they look as a result of the following settings:

Configuring Axis Tick Marks 2.png

In XAML:

<ig:XamScatterSurface3D Name="SurfaceChart"
 ItemsSource="{Binding Path=DataCollection}"
 XMemberPath="X" YMemberPath="Y" ZMemberPath="Z">
 <ig:XamScatterSurface3D.XAxis>
        <ig:LinearAxis Title="X Axis"
 TickmarkMinimumValue="-10"
 TickmarkMaximumValue="10" />
 </ig:XamScatterSurface3D.XAxis>
</ig:XamScatterSurface3D>

In C#:

…
var linearAxis = new LinearAxis();
linearAxis.Title = "X Axis";
linearAxis.TickmarkMinimumValue = -10;
linearAxis.TickmarkMaximumValue = 10;
SurfaceChart.XAxis = linearAxis;

In Visual Basic:

…
Dim linearAxis = New LinearAxis()
linearAxis.Title = "X Axis"
linearAxis.TickmarkMinimumValue = -10
linearAxis.TickmarkMaximumValue = 10
SurfaceChart.XAxis = linearAxis

Related Content

Topics

The following topics provide additional information related to this topic.

Topic Purpose

This topic explains how to configure the brush and thickness of the grid lines in the xamScatterSurface3D control.

This topic explains how to configure the axis interval in the xamScatterSurface3D control.

The topics in this group explain how to configure different aspects of the visual representation of the axis label in the xamScatterSurface3D control.

This topic explains how to configure the axes lines in the xamScatterSurface3D control.

This topic explains how to configure the axis range by setting the MinimumValue and MaximumValue properties in the xamScatterSurface3D control.

This topic explains the axis types available in the xamScatterSurface3D control.

The topics in this group explain how to configure different aspects of the visual representation of the axis title in the xamScatterSurface3D control.

This topic explains how to invert an axis in the xamScatterSurface3D control.