
Ignite UI for Angular
The World’s Most Versatile Data Chart for Angular
Visualize any type of data, business, financial, scientific, and scatter, with the capability of millisecond updates with millions of data points in your Angular apps. With over 50 chart types, 13 Trend Line options, over 25 financial indicators all designed with responsive UI, HTML5, and touch-first in mind, power your most demanding visualizations with Infragistics charting.
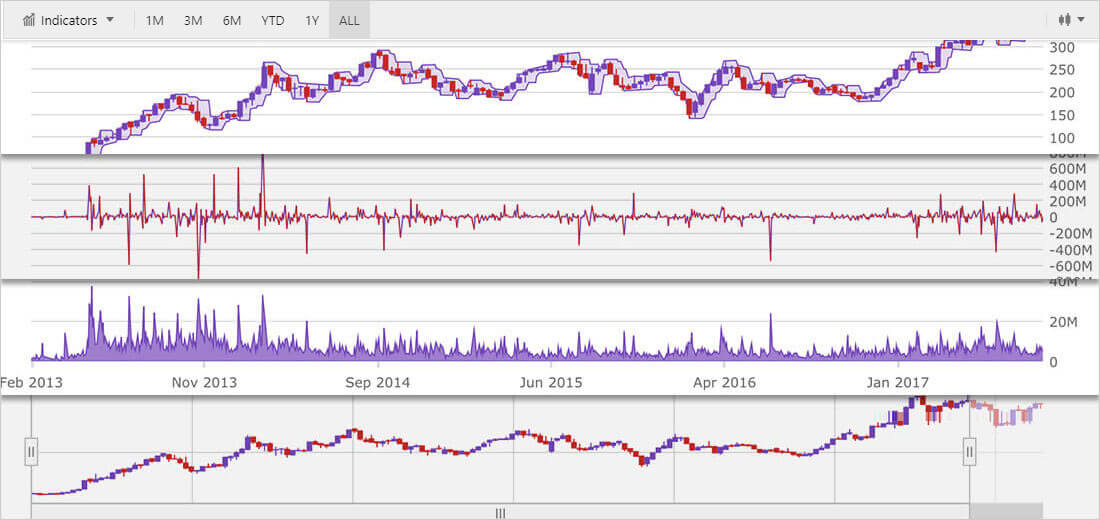
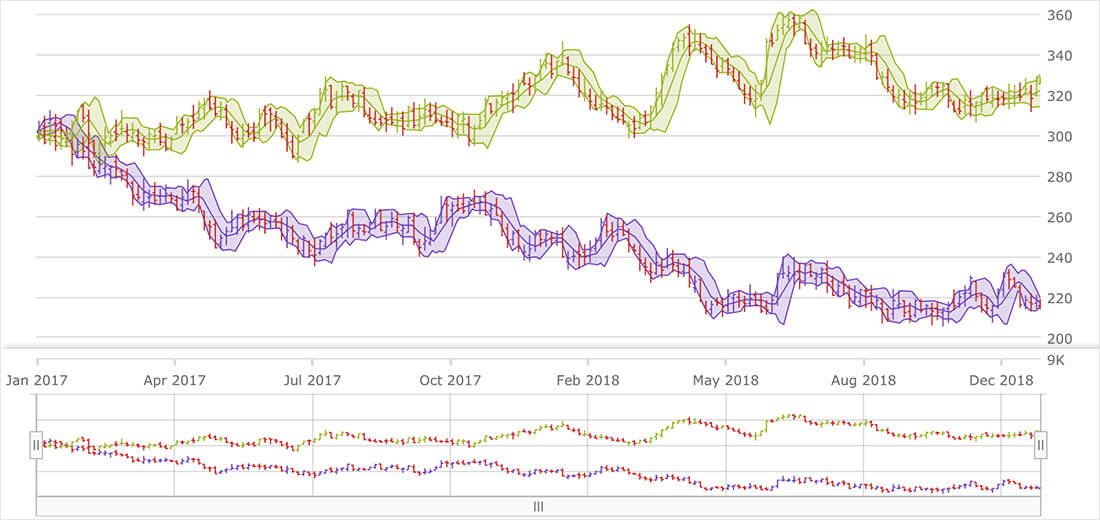
Time Series Data and Financial Charting Included
Show how your data changes over time with our built-in Time Axis. We’ll dynamically change time scales and label formats, as you interact with your chart. We’ve included a complete Financial Chart with all of the features you’ve come to expect in your financial charts, like Yahoo Finance or Google Finance.
Build Composite Charts with Custom Tooltips
Visualize your data by creating new composite views and overlapping multiple series in single chart. In the Category Chart, you can display and overlap multiple chart columns to create stacked columns. In addition, you can customize tooltips with images, data binding, and even combine tooltips of multiple series into single tooltip.
Real-Time, High-Performance Charting with No Compromise
Display millions of data points with milliseconds-level updates in real time with live, streaming data. You will experience no lag, no screen-flicker, and no visual delays, even as you interact with the chart on a touch-device.
Charts for Every Type of Visualization
Category Charts
Bar Chart, Column Chart, Line Chart, Pie Chart, Funnel Chart, Doughnut Chart, Spline Chart, Area Chart, Spline Area Chart, Step Line Chart, Step Area Chart, Range Area Chart, Range Column Chart, Waterfall Chart, and Point Chart
Financial Chart
Render both Candlestick and OHLC bar charts, with 25+ built-in technical indicators (like Moving Averages, Bollinger Bands, Money Flow Index, MACD, Wilder's RSI).
Ignite UI for Angular Chart Features
Download the Highest Performing Angular Charts Today!
Modular Design
The Angular chart is designed for modularity. Only features that are needed are part of your deployment, so you get the smallest possible footprint in your rendered pages.
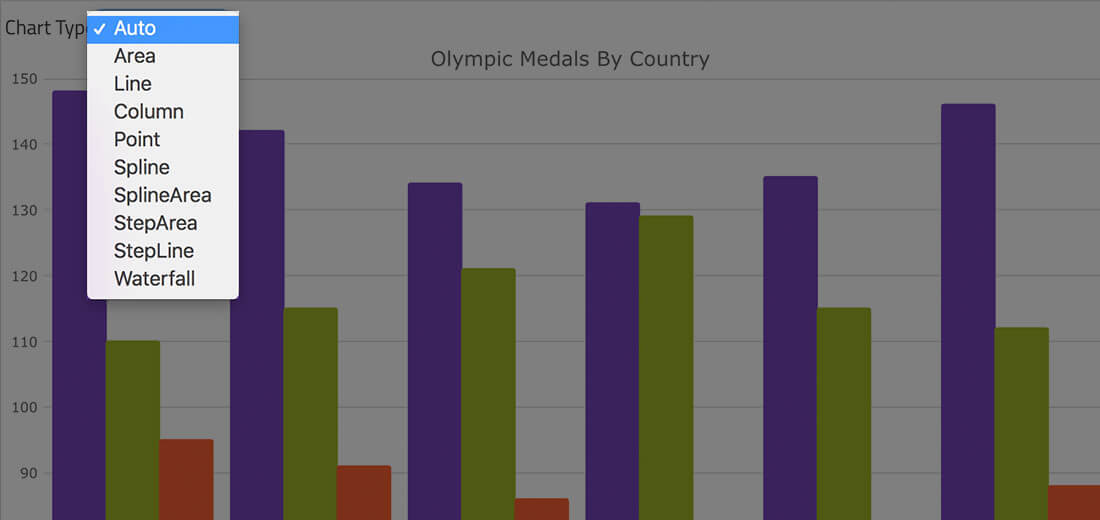
Smart Data Binding
Let us choose the chart type. Our smart Data Adapter automatically chooses the best chart type for the data. All you do is set the data source and we do the rest.
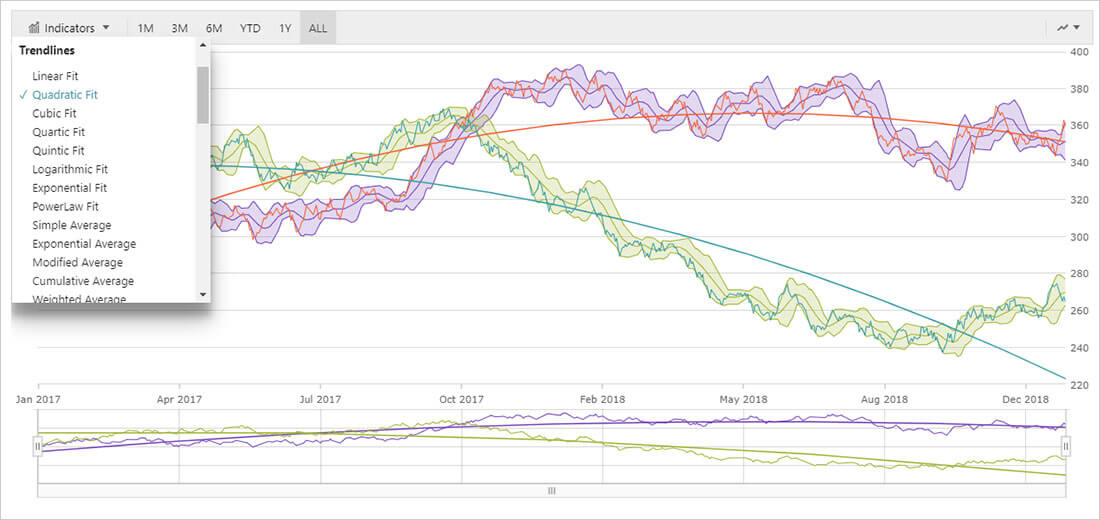
Trend Lines
We support every trend line you’ll ever need, including linear (x), quadratic (x2), cubic (x3), quartic (x4), quintic (x5), logarithmic (logn x), exponential (ex), and power law (axk + o(xk)) trend lines.
Interactive Panning and Zooming
Use single or multi-touch, keyboard, zoom bar, mouse wheel, drag-select for any rectangular region with the mouse to zoom in for close-up look at data points, scroll data history, or pan data regions.
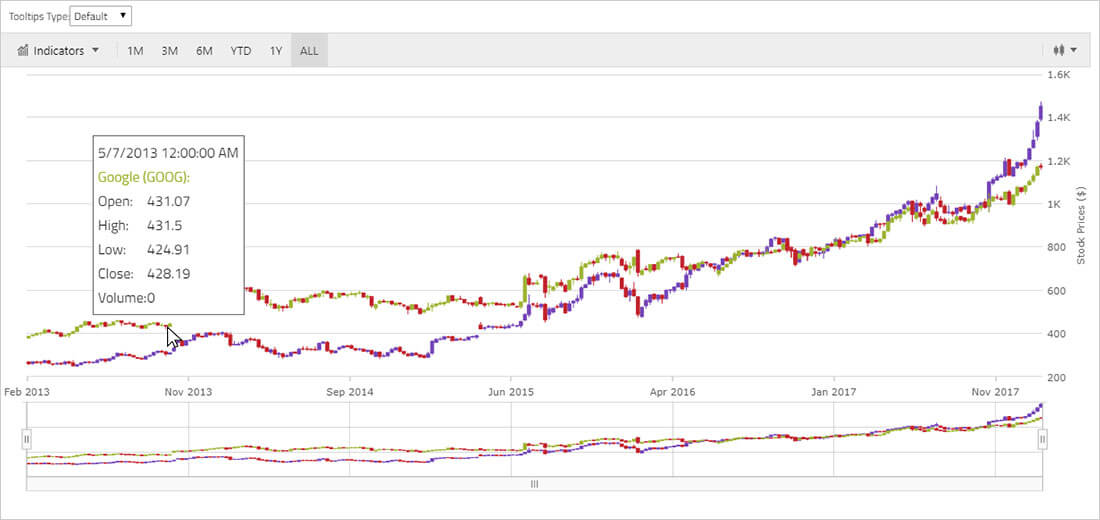
Markers, Tooltips, and Templates
Use one of 10 marker types to highlight data or use simple tooltips or multi-axis and multi-series chart tooltips with custom chart templates to give more context and meaning to your data.
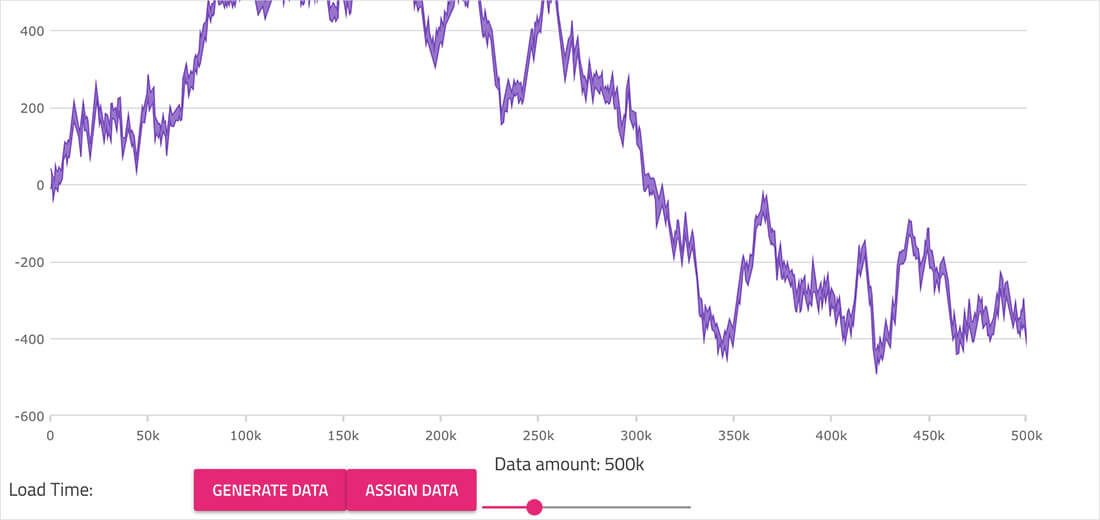
High-Volume Data Handling
Optimize the performance of your financial chart to render millions of data points by modifying the changeDetection setting. This setting lets you control how Angular treats your data array when looking for changes and keeping your high-volume chart smoothly running.
Download the Highest Performing Angular Charts Today!
But Wait, There’s More!
If you are considering any other Angular Charts on the market, here are a few things to think about:
- We include over 50 chart types, with the simplest configuration on the market with our smart data adapter.
- The chart is optimized per platform. We have a native Angular chart, a React chart, a jQuery / JavaScript chart, a WPF chart, a Windows Forms chart, and a Xamarin chart, all supporting the same API and same features on every platform.
- Our financial charting gives you everything you need for a Yahoo Finance or Google Finance-like experience – all with a single line of code.
- Ignite UI for Angular is built on Angular for the Angular developer, with zero 3rd party dependencies. We are 100% optimized for Angular.
- We test against everyone else’s performance. Everyone says they are fast and can handle lots of data, but we can prove it. See for yourself how we handle high-volume data and real-time data streaming.
- We are here 24x5. Infragistics has global support that is always online. For North America, Asia Pacific, Middle East, and Europe, we are on the clock when you are!
- We have 50+ more UI controls and components besides the Angular Charts. We offer a complete Angular solution to build modern web, mobile, and PWAs!
- We offer the world’s first, and only, end-to-end comprehensive design to code platform for UX Designers, Visual Designers, and Developers that will generate pixel-perfect Angular components from Sketch designs. With Indigo.Design, everything you craft in Sketch from our Indigo Design system matches to our Ignite UI for Angular components.
Ignite UI for Angular Components
Here’s the full value you get with Ignite UI for Angular
Pricing
- 100+ enterprise-grade UI components for Angular, React, Web Components, and Blazor
- High-performance data grid, charts, and scheduling controls built for real-world scale
- AI-assisted development tools: Ignite UI CLI, MCP Server, and Agent Skills
- Includes everything in Ignite UI and Professional
- The only complete UI/UX toolkit for building high performance, modern web, desktop and mobile applications
- App Builder included — drag-and-drop WYSIWYG with production-ready code output