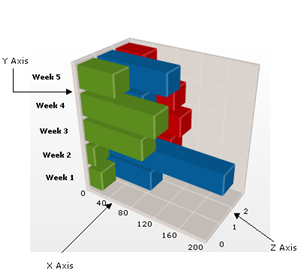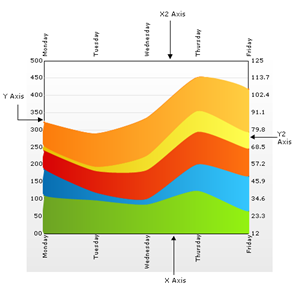

An axis is a line which represents one dimension upon which chart data is plotted. 2D charts must plot their data on two axes ( X and Y ). 3D charts must plot their data on three axes (X, Y, and Z ).
Additionally, Chart offers "opposite" axes which exist parallel to each axis, on the opposite side of the chart data. These axes are X2 and Y2 for 2-D charts, X2, Y2, and Z2 for 3D charts.