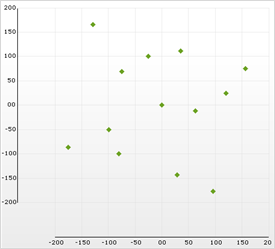

By default, Chart will display data across 100% of its axes, like in the following image:
Axis margins allow the application developer to add spacing on each side of any axis. This can often improve the look and clarity of a chart.
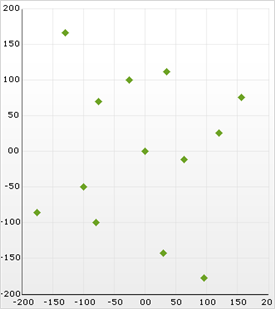
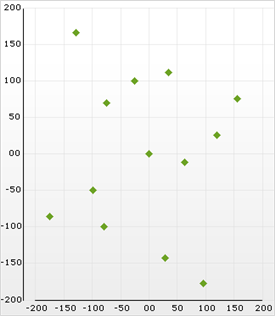
Here is an image of the same chart as above, with a 5% margin added at the Near and Far ends of the X-axis:
To customize axis margins, use the following properties (where N is the axis being customized):
UltraChart.Axis.N.Margins.Near
UltraChart.Axis.N.Margins.Far
Margin size can be set using a pixel value, a percentage value, or a data value. Set the MarginType property to the appropriate unit of measurement. The Value property will determine how much space to use for the margin.
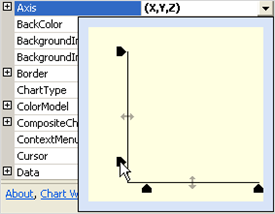
Additionally, an editor control is provided which can be used to adjust axis margins. This editor can be found on the axes tab of the chart wizard, or by clicking on the UltraChart.Axis property in the properties grid: