UltraChart.Axis.Y.RangeType = AxisRangeType.Custom
UltraChart.Axis.Y.RangeMin = 0
UltraChart.Axis.Y.RangeMax = 75
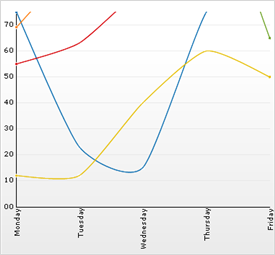
On a numeric axis, the axis range is the difference in numeric value from the beginning of the axis to the end. The range minimum is the value at the lowest point of the axis. The range maximum is the value at the highest point of the axis.
By default, Chart uses the minimum and maximum values in the data as the range for the numeric axis (or axes). To manually specify the range, set the UltraChart.Axis.n.RangeType property to Custom and set values for the UltraChart.Axis.n.RangeMin and UltraChart.Axis.n.RangeMax properties, where n is the letter of the axis in context (X, X2, Y, Y2, Z, or Z2).
UltraChart.Axis.Y.RangeType = AxisRangeType.Custom
UltraChart.Axis.Y.RangeMin = 0
UltraChart.Axis.Y.RangeMax = 75