
This topic provides detailed instruction on the controls and new and enhanced features for Infragistics® Windows Forms® 2015 Volume 2 release.
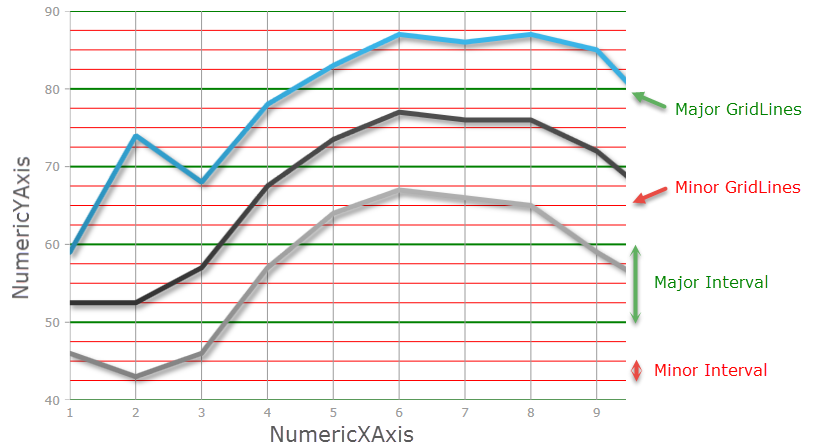
The DataChartView’s now supports both Major and Minor intervals which are displayed perpendicular to its axes .
The following screenshot displays a major interval on the NumericYAxis, using major interval value of 10, with a green stroke; and a minor interval on the NumericYAxis, using minor interval value of 2.5, with a red stroke.
This topic describes how to use the SaveTo method of the element to save an image of the UltraDataChart
This topic describes how to use the Scale Legend for the UltraDataChart
This topic explains how to use the Bubble Series in the UltraDataChart
This topic explains how to use the Stacked Series in the UltraDataChart
This topic explains the common properties for the Polar Series in the UltraDataChart
This topic explains the common properties for the Radial Series in the UltraDataChart
This topic demonstrates how to use the Numeric Angle Axis in the UltraDataChart
This topic demonstrates how to use the Category Angle Axis in the UltraDataChart
This topic describes how to use the Numeric Radious Axis in the UltraDataChart
This topic describes how to use the Numeric Radious Axis in the UltraDataChart
This topic provides conceptural information about the annotations andhover interactions available on the UltraDataChart
This topic provides information about the category tooltip layer used for hover interactions available on the DataChart
This topic provides information about the item tooltip layer used for hover interactions available on the DataChart
This topic provides information about the crosshair layer used for hover interactions available on the DataChart
This topic provides information about the category highlight layer used for hover interactions available on the DataChart
This topic provides information about the category item highlight layer used for hover interactions available on the DataChart
This topic introduces the Value Overlay feature of the DataChart
This topic provides a conceptual overview of how to use subscript and superscript formatting in the FormattedTextEditor or FormattedLinkLabel controls.
This topic demonstrates the usage of the StartPosition and StartLocation properties for the UltraMessageBoxInfo control.
This topic demonstrates the usage of the MinSummaryRowHeight and DefaultSummaryRowHeight properties of the UltraGrid.
This topic demonstrates the usage of the new NotificationBadges feature for the UltraToolbarsManager
This topic describes how to use the FlatDataSource Data Adapters to bind to the WinPivotGrid
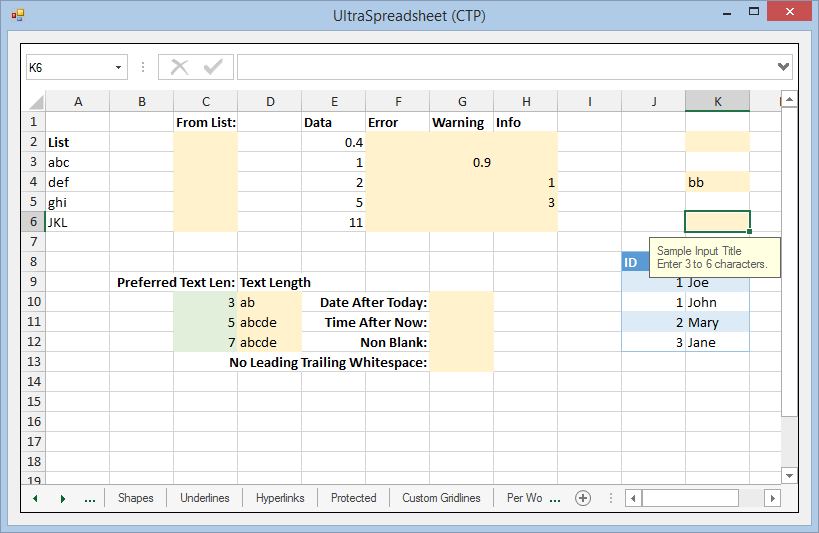
The Spreadsheet control allows visualizing and editing of spreadsheet data, represented by the data model supported by the Infragistics Excel Engine. The following screenshot shows the Spreadsheet control displaying some spreadsheet data: