• APAC영업팀: APACSales@infragistics.com
  • 한국 연락처
  • 로그인
Infragistics logo Infragistics logo
메뉴
  • APAC영업팀: APACSales@infragistics.com
  • 로그인
  • 디자인 / 개발디자인 / 개발
    • 가성비 번들
      Infragistics Ultimate $1,495 고성능, 최신 웹, 모바일 및 데스크탑 애플리케이션을 구축 할 수있는 완벽한 UX / UI 툴킷
      Infragistics Professional $1,295 데스크탑, 웹 및 모바일 개발자를위한 포괄적 인 UI 구성 요소 라이브러리
      Ignite UI $1,295 현대적이고 데이터가 풍부하고 반응이 빠른 웹 앱을 구축하기위한 완벽한 UI 구성 요소 라이브러리
    • Web
      App Builder (new) Ignite UI Angular ASP.NET Core ASP.NET MVC Blazor jQuery React Web Components Ultimate UI for ASP.NET Web Forms Indigo.Design
    • Desktop
      Ultimate UI for Windows Forms Ultimate UI for WPF
      Cross Platform
      Ultimate UI for Uno Ultimate UI for UWP Ultimate UI for WinUI Ultimate UI for Xamarin
    • Design to Code
      Indigo.Design App Builder (new)
      Automated Testing Tools
      Test automation for Micro Focus UFT: Windows Forms Test automation for Micro Focus UFT: WPF Test automation for IBM RFT: Windows Forms
  • UX
    • Indigo.Design Desktop UX 및 사용성 전문가를위한 협업 프로토 타입 및 원격 사용성 테스트
    • Indigo.Design 시각화 디자인, UX 프로토 타이핑, 코드 생성 및 앱 개발을위한 통합 플랫폼
  • 비즈니스 인텔리전스
    • Reveal Embedded 강력하고 아름다운 BI 대시 보드로 앱 출시 시간을 단축하세요.
    • Slingshot 조직의 모든 사람이 데이터를 사용하여 보다 현명한 비즈니스 결정을 내릴 수 있도록 지원하세요.
  • 팀 생상성
  • 학습 및 지원Support
    • 도움말 및 지원문서
    • 블로그
    • 포럼
    • 제품 아이디어
    • 참조 어플리케이션
    • 고객 스토리
    • Webinars
    • eBook 및 백서
  • 무료 체험판
  • 가격
    • 제품가격/ 온라인구매
    • 연락처
    • 구독이란?
  • 지원정책
 
WPF | 컨트롤
  • 평가판 받기
개인 정보 보호: 우리는 당사의 웹 사이트에서의 경험을 향상시키기 위해 자체 및 타사 쿠키를 사용합니다. 웹 사이트를 계속 사용함으로써 귀하는 그들의 사용을 수락 함을 이해합니다. 쿠키 정책
닫기
  • 그리드 및 목록
    • Carousel Listbox
    • Data Cards
    • Data Carousel
    • Data Grid
    • Data Presenter
    • Grid
    • Pivot Grid
    • Property Grid
    • Spreadsheet
    • Tree Grid
    • Tree List
  • 차트
    • Category Chart
    • 3D Surface Chart
    • Data Chart
    • Doughnut Chart
    • Financial Chart
    • Funnel Chart
    • Pie Chart
    • Scatter Chart
    • Shape Chart
    • Sparkline Chart
  • 바코드
    • Barcode
    • Barcode Reader
  • 데이터 입력 및 표시
    • Color Picker
    • Combo Box Editor
    • Formula Editor
    • Inputs
    • MultiColumn Combo
    • Rich Text Editor
    • Spell Checker
    • Syntax Editor
  • 데이터 비주얼라이제이션
    • Diagramming
    • Gantt View
    • Geographic Map
    • Network Node
    • Org Chart
    • Treemap
    • Zoombar
  • 프레임워크
    • Calculation Manager
    • Drag and Drop Framework
    • Excel Library
    • Math Library
    • Persistence Framework
    • Syntax Parsing Engine
    • Undo Redo Framework
    • Word Framework
    • WPF Reporting
  • 게이지
    • Bullet Graph
    • Linear Gauge
    • Radial Gauge
  • 상호 작용
    • Busy Indicator
    • Dialog Window
    • Slider
  • 레이아웃
    • Carousel
    • Dock Manager
    • Tab
    • Tile Manager
  • 메뉴
    • Context Menu
    • Menu
    • Outlook Bar
    • Radial Menu
    • Ribbon
    • Tag Cloud
  • 일정
    • Calendar
    • Month Calendar
    • Schedule
    • Timeline
  • 스타일 및 테마
    • Resource Washer
    • Theme Manager
  • 생산성 팩
    • Configurators

WPF 3D Surface Chart

The 3D Surface Chart control allows fast, visually appealing and customizable 3D surface visualizations. The control offers a full set of API options to achieve any 3D surface plotting requirement and very intuitive defaults to minimize the coding required.

WPF 샘플 다운로드

Fully Customizable

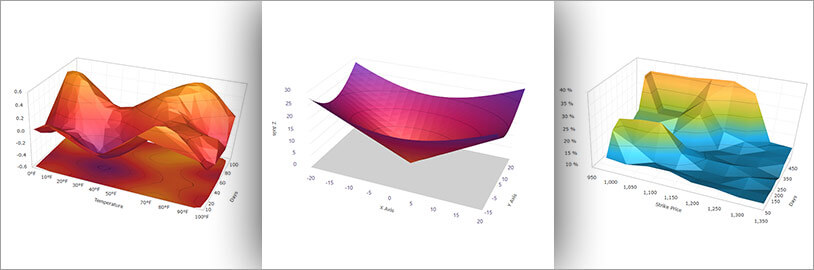
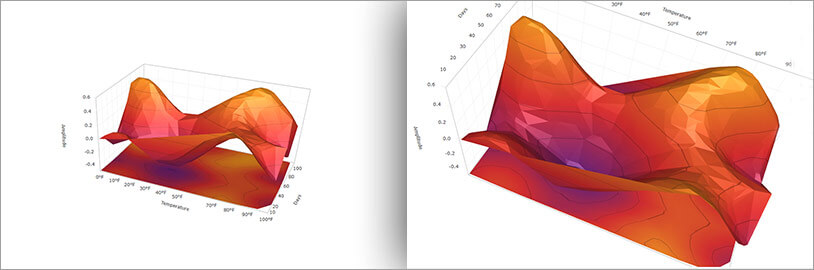
The 3D Surface Chart comes with a rich set of themes. These visual presets help to blend the control in different color scheme variations. Further, the control offers full customization options for many of its key elements, such as colors, labels, textures, markers - from changing the text or formatting to completely re-templating them.

Fully Customizable

Intuitive Interactions

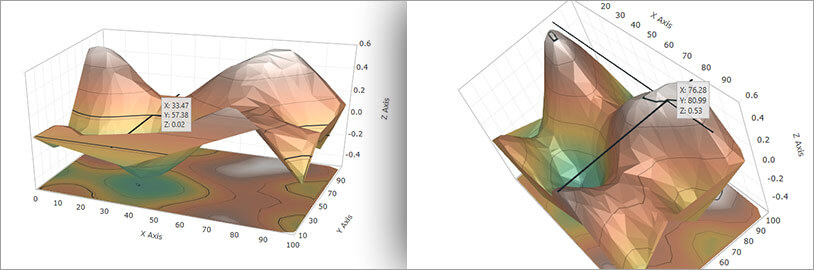
Allow users to interact with their data by zooming or rotating along all three axes, all with touch support to take advantage of today’s modern devices.

Intuitive Interactions

Data Sampling

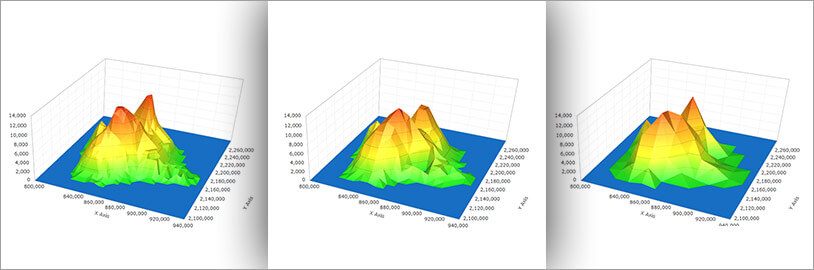
Create a surface chart with thousands of data points that are capable of millisecond updates. This chart enables heavy-duty data visualization and analysis on large volumes of data with high performance.

Data Sampling

Insightful Data Visualizations

Use Tooltips via mouse tracking to show data related to the point you’re currently hovering over. Or use horizontal and vertical Gridlines for better usability and pointer tracking, or Crosshairs all to better drill down into your data.

Insightful Data Visualizations
  • 제품
    • 디자인&개발
    • UX Pros
    • 비즈니스 팀
    • 모두 보기
    • 무료 체험판
  • 학습&지원
    • 도움말&API 문서
    • 블로그
    • 기술 지원 채팅
    • 포럼
    • 제품 아이디어
    • 요청 제출
  • 내 계정
    • 섭크립션 관리
    • 지원 요청
  • 회사
    • 회사 소개
    • 채용 정보
    • 법률
    • 뉴스&이벤트
    • 파트너
최신 상태 유지

최신 블로그, 전자책, 이벤트, 백서를 받아 보십시오.

가입하기!
Ginza Wall Building UCF 5F 6-13-16 Ginza Chuo-ku, Tokyo, 104-0061, Japan
  • 개인 정보 보호 정책(갱신)
  • 쿠키
  • 이용 약관(갱신)
© Copyright 2023 INFRAGISTICS. All Rights Reserved
Back to top of page