
WPF Pivot Grid
The WPF pivot grid lets users slice, dice, and filter the multidimensional data of your OLAP cube or data warehouse, putting the full power of online analytical processing within your WPF applications.
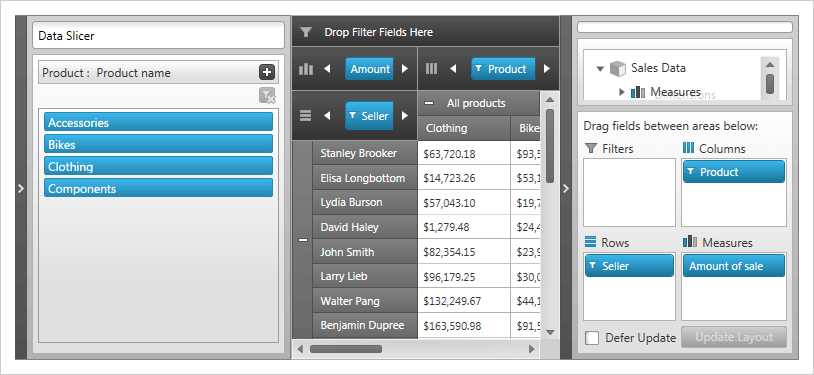
WPF 샘플 다운로드Data Slicer
Data Slicer filters information quickly and interactively. Don’t waste time figuring out what the data means and how it's shaped. Simply pre-define the filter in a slicer and provide your end users with a simple interaction/analysis model.
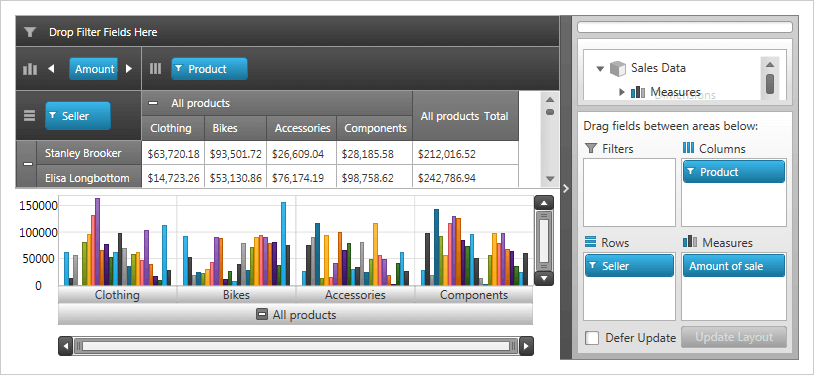
OLAP Data Source
Give end users a true drill-down experience by integrating our xamDataChart control with an OLAP data source.
WPF Business Intelligence
Our WPF OLAP Pivot Grid lets users work with multidimensional data (MDX) from your cubes, XMLA SAP and Oracle data warehouses, or Microsoft SQL Server Analysis Services.
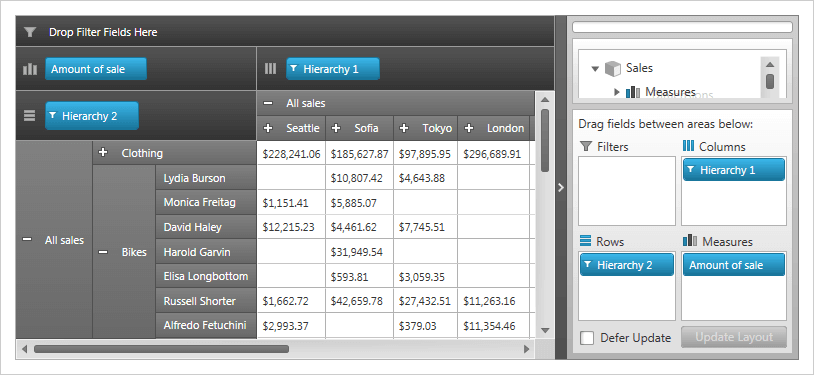
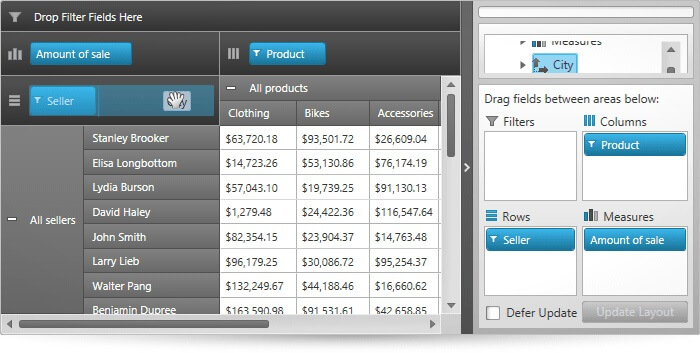
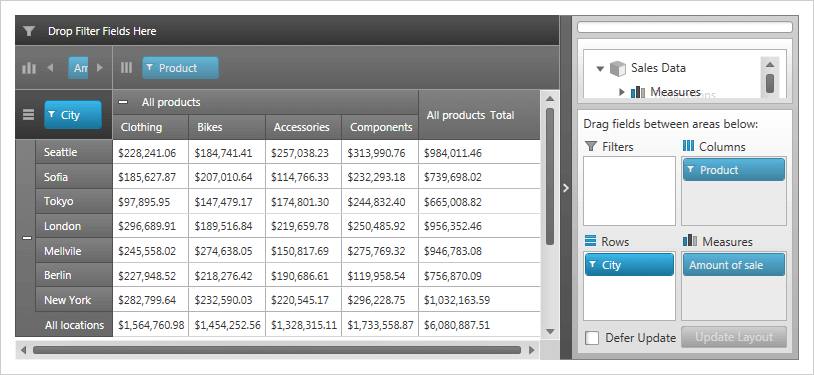
Drag & Drop
Drag and drop fields intuitively from the field selector onto the xamPivotGrid. Users can rearrange the fields within row and column groups to see their data sliced and diced as desired.
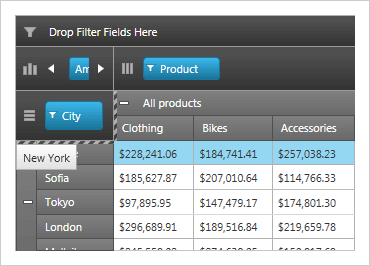
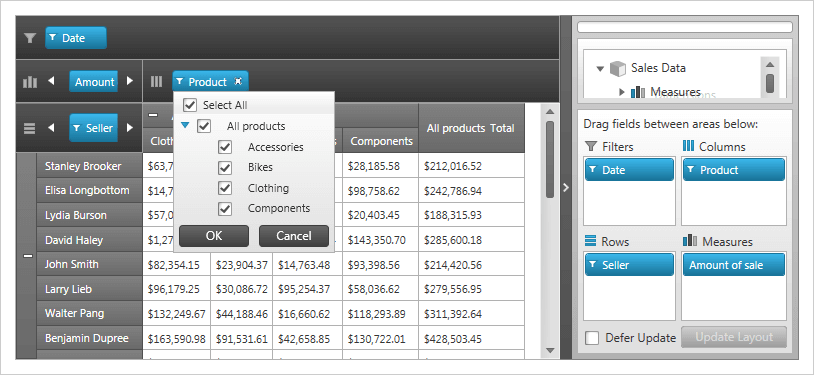
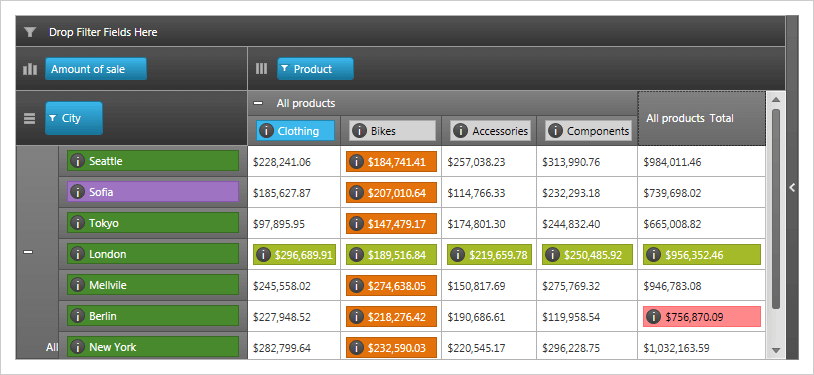
Filtering
Let users filter the data so they see only the data pertinent to their analysis.
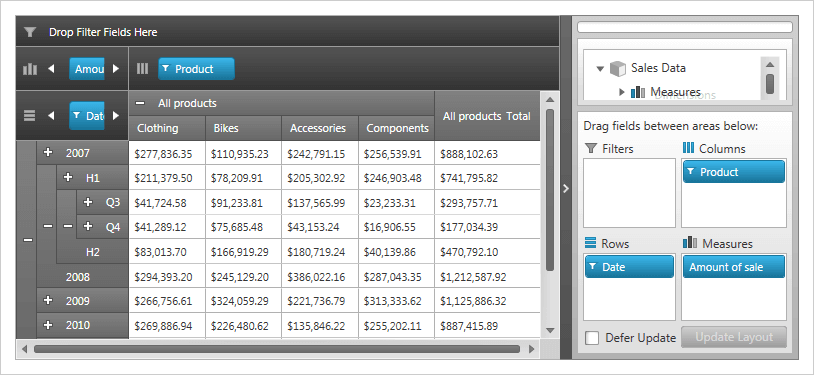
Drilldown
Expandable row and column fields to allow your users to drilldown into the data and extract meaning from the numbers.
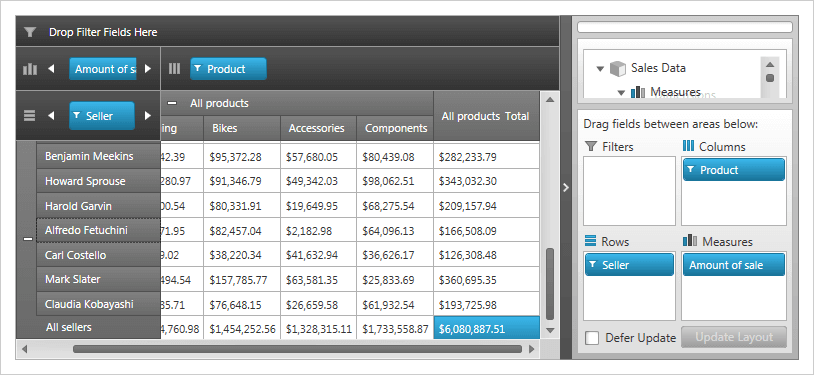
Summaries
Row and column groups are totaled in summary fields, so users can make quick part-to-whole comparisons.
Custom Header and Cell Templates
Specify custom data templates for cells, headers, and rows.
Disabled Components
Enable or disable the sub components of the pivot grid for logical pivoting of data.
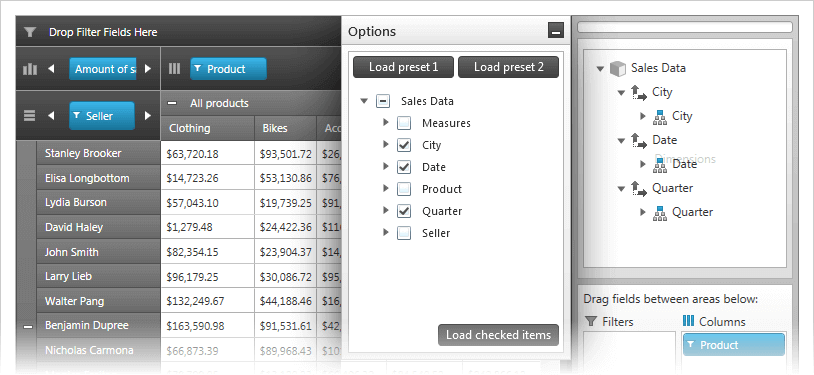
Dynamic Metadata Tree
Choose which items are included or excluded in the metadata tree.

Hiding Columns and Rows
Users can hide columns and rows from the grid and can hide columns and rows programmatically.